
Figure 1.
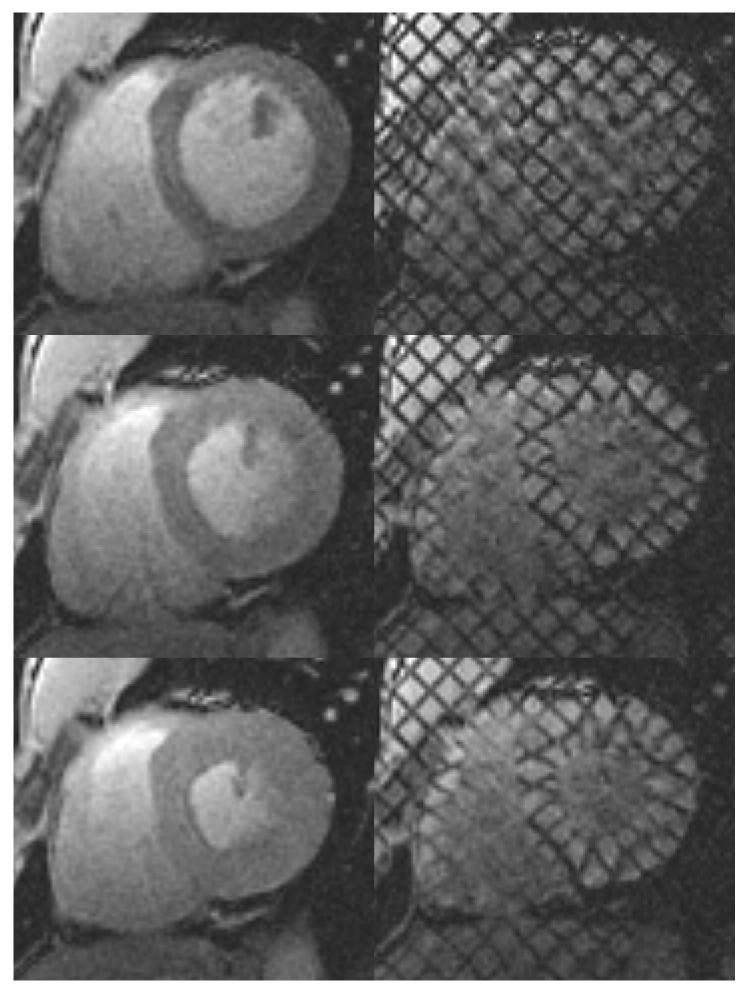
Left: standard cardiac MR images. Right: for the same heart, location and cardiac phase, the corresponding tagged MR images. Top: at end-diastole, when the ventricular cavity is at its maximum filling, right after tagging. Middle: At mid-systole, when the heart is contracting. Bottom: at end-systole, when the maximum amount of blood has been ejected and the heart muscle is at its maximum contraction.