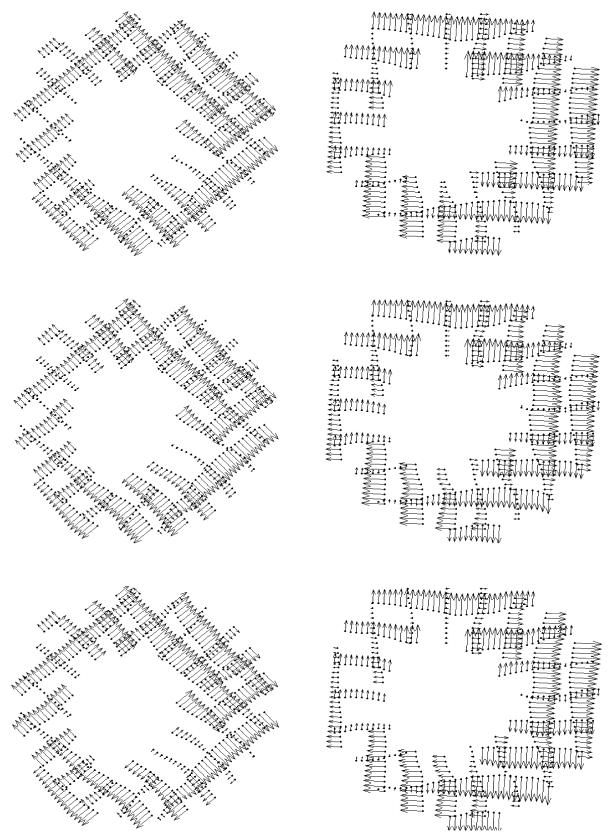
Figure 6.
Top row: original tag displacements of set1 (left) and set2 (right) at a sample short axis plane. Middle row: displacements at tag points for both sets, calculated using the inverse field parameters of the same set. Bottom row left: displacement values at tag locations of set1, calculated using the displacement field parameters of set2. Bottom row right: tag displacements of set2 using the parameters of set1.

