Abstract
A technique for cardiac- and respiratory-resolved MRI is described. A retrospectively gated-segmented acquisition scheme similar to that used in conventional cine cardiac imaging was used to collect image data that spanned both the cardiac and respiratory cycles. Raw k-space data were regridded in a cardiorespiratory phase space to allow image reconstruction at target cardiac and respiratory phases. The approach can be applied with various k-space trajectories and pulse sequences, and was implemented in this study with both a Cartesian steady-state free precession (SSFP) sequence and a radial phase-contrast (PC) pulse sequence. Free-breathing short-axis SSFP images of the heart were reconstructed at multiple respiratory and cardiac phases to illustrate separation of cardiac and respiratory motion without artifacts. A respiratory-resolved radial PC experiment was used to quantify the volumetric flow rates in the inferior vena cava (IVC), pulmonary artery (PA), and aorta (Ao) in five free-breathing normal volunteers and a positive-pressure ventilated dog. Total flow (ml/min) in each vessel was quantified as a function of respiratory phase (peak/minimum output = 1.85 ± 0.29 (IVC), 1.36 ± 0.15 (PA), 1.24 ± 0.09 (Ao)). Peak flow occurred during inspiration for the IVC and PA, and during expiration for the Ao, and there was a complete pattern reversal for the positive-pressure ventilated dog.
Keywords: MRI, breathing, respiration, phase contrast, SSFP, radial
The influence of breathing is ubiquitous in cardiac imaging. Breathing motion is most commonly treated as a source of artifact that can be minimized by breath-holding, respiratory gating, motion correction, or real-time imaging. Despite the undesirable consequences of breathing in conventional cardiac imaging, the underlying variations in thoracic pressure and morphology associated with respiration also modulate cardiovascular function and can provide basic physiologic and diagnostic information. For example, measuring variations in left ventricular (LV) filling velocity with inspiration and expiration with Doppler ultrasound is a standard test for distinguishing ventricular constriction from restriction (1). In recent years, MRI has been developed by several groups to measure cardiovascular function throughout the breathing cycle. Imaging strategies include breath-held imaging at different static phases of the respiratory cycle (2), real-time imaging (3-8), and cardiac- and respiratory-resolved imaging (9). Imaging at incremented breath-hold positions would not be expected to capture the complex interplay between thoracic and intracardiovascular pressures, global motion, and cardiovascular hemodynamics. Real-time imaging with MRI provides only moderate spatial and temporal resolution for magnitude images and poor resolution for blood velocity (phase contrast (PC)) applications, because of the need for at least two flow-encoding steps and the overhead required for flow encoding. Fredrickson et al. (9) introduced a segmented imaging technique that can resolve motion across both cardiac and respiratory cycles, and offers higher spatial and temporal resolution than can be achieved with real-time imaging. In the current study a general method similar to that described in Ref. 9 was developed to acquire and reconstruct images with resolution of cardiac and respiratory motion. The acquisition and reconstruction methods introduced in this study are insensitive to the MRI pulse sequence. In particular, both conventional Cartesian and radial projection k-space trajectories are presented for a steady-state free precession (SSFP) and PC experiment, respectively. Cine mechanical function and volumetric rates of blood flow were measured in several great arteries during free breathing. For all cases, images were reconstructed that spanned both the cardiac and respiratory cycles to allow measurement of functional parameters, such as cardiac output, at several respiratory phases, and visualization of myocardial geometry as a function throughout these cycles. The flow in the inferior vena cava (IVC), pulmonary artery (PA), and aorta (Ao) were measured as a function of the respiratory cycle in five free-breathing normal volunteers with a coached breathing pattern, and in a positive-pressure ventilated canine. Additionally, cardiac- and respiratory-resolved cine images were acquired from five volunteers under conditions of normal breathing.
THEORY
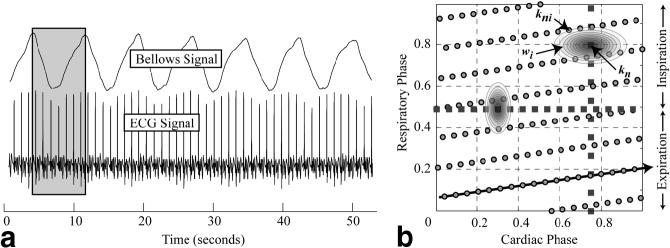
Figure 1 outlines the data acquisition scheme proposed for the cardiorespiratory-resolved experiments. A retrospectively gated-segmented approach was used to collect information about both cardiac and breathing motion. As shown in Fig. 1, each segment of k-space is acquired repeatedly so as to span at least one breathing cycle and several cardiac cycles. A complete image is formed by combining several segments of k-space acquired over several breathing cycles. As is the case with conventional retrospectively gated experiments, each line of k-space is assigned a time or phase within the cycle of interest. For all results presented in this study, we characterized the respiratory cycle by assigning a phase to each line of k-space acquired based on the breathing waveform measured with a bellows wrapped around the volunteer’s waist. Nonetheless, the reconstruction methods outlined below can be applied with the use of any signal that is used to derive a respiratory phase. As shown in Fig. 1, end-inspiration is defined as the reference or zero respiratory phase; however, this definition is arbitrary, and end-expiration could also have been defined as the reference phase. The raw k-space data are rebinned within the cardiorespiratory phase space to fall on a uniform grid, where each grid location corresponds to an image to be reconstructed at the specified cardiac and respiratory phase. This process is a 2D analog to the rebinning procedure used in conventional retrospectively-gated cardiac imaging (10). An illustrative example is provided in Fig. 2, which shows raw ECG and bellows tracings collected from a normal volunteer (Fig. 2a) and the corresponding cardiac and respiratory phases from a single respiratory cycle (Fig. 2b). The slanted arrow in Fig. 2b shows the real-time path of cardiac and respiratory phases for the acquired k-space data, beginning from the lower left corner. The rebinning of the raw k-space data (circles) to each target grid location (squares) is achieved by convolution with an interpolation kernel that weights the contribution of the neighboring k-space data to the target location. Sample kernels are shown in Fig. 2b that would be used to reconstruct images along the vertical and horizontal lines, which correspond to respiratory-resolved images at end-diastole and cardiac-resolved images at end-expiration, respectively. The implementation of the kernel is outlined in the Appendix.
FIG. 1.
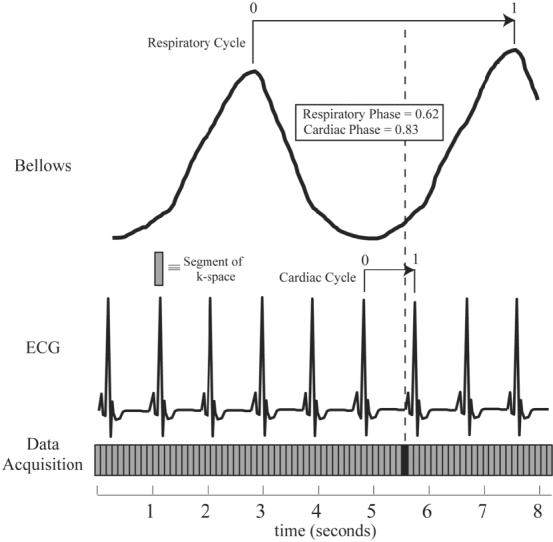
Retrospectively gated-segmented data acquisition scheme for imaging with resolution of both cardiac and respiratory phase information. Each segment of k-space (indicated by the shaded rectangle) is acquired for at least a complete respiratory cycle and several cardiac cycles. Respiratory and cardiac phases (numbered from 0 to 1) are assigned to each k-space segment based on the measured ECG and respiratory bellows signals.
FIG. 2.
Sample ECG and bellows signals from a volunteer and the filling of cardiorespiratory phase space. a: The gray insert indicates the duration of the repeated acquisition of a single segment of k-space over ∼7 s, spanning a complete breathing cycle and seven heartbeats. The cardiac and respiratory phases of each segment of k-space are shown as the circles in b. The squares in b show two reconstruction trajectories: the vertical line represents images with resolution of respiration with no cardiac motion, and the horizontal line represents a breath-hold-like series of cardiac-resolved images, with no respiratory effects. The ellipsoidal shapes, wi, on each dashed line illustrate the asymmetric kernels that are used for regridding. The labels kni and kn indicate the acquired k-space data and the resulting interpolated value, respectively.
The data acquisition and reconstruction methods outlined here differ significantly from the time-resolved imaging by automatic data segmented (TRIADS) approach used in previous work by Fredrickson et al. (9). Specifically, TRIADS is a prospective method that is designed to order the data acquisition in synchrony with respiratory phase, which necessitates real-time monitoring and triggering based on the respiratory phase. In contrast, the approach outlined in this work is retrospective and thus requires no real-time feedback to determine k-space ordering. Furthermore, in order to reconstruct images at desired cardiac phases, TRIADS interpolates data only along the data acquisition dimension, which corresponds to the direction indicated by the slanted arrow in Fig. 2b. As shown in Fig. 2b, the interpolation kernel used in this study incorporates k-space data from a 2D region of cardiorespiratory phase space as determined only by the kernel itself, and is not limited to a single direction.
MATERIALS AND METHODS
All MR measurements were performed on a Siemens 1.5 T Sonata scanner (Siemens Medical Systems, Erlangen, Germany) using the body and spine array of coils for signal reception. ECG and bellows waveforms were recorded to a text file during acquisition via the Siemens physiological monitoring unit. These waveforms were time-stamped to allow synchronization with the raw image data prior to reconstruction. Cine magnitude images were acquired with an SSFP pulse sequence with TE/TR = 1.5 ms/3.0 ms, flip angle = 60°, BW = ±120 kHz, FOV = 320 × 240 mm, matrix = 256 by 144, and slice thickness = 6 mm. Eighteen views were acquired per segment for a temporal resolution of 54 ms. For the majority of PC studies a spoiled gradient-recalled echo radial acquisition scheme was employed (11) with TE/TR = 3.0 ms/4.5 ms, flip angle = 20°, BW = ±80 kHz, FOV = 320 × 320 mm, 176 readout points with 96 projections, six views per segment, a 6-mm slice and a velocity encoding (Venc) strength that ranged from 80 to 150 cm/s. Through-plane blood velocity was encoded using conventional alternating bipolar gradients, with opposite first moments in sequential acquisitions. With the interleaved projections for the two flow-encoding steps, the temporal resolution was 54 ms. Phantom studies on a ventilator-controlled breathing motion phantom were used to evaluate respiratory-resolved SSFP magnitude imaging, using the same pulse sequence parameters listed above. No cardiac motion was present in this study, but a synthetic ECG waveform was used to assign a cardiac phase for reconstruction purposes. The bellows tube was connected directly to the ventilator to provide a breathing waveform for determination of the respiratory phase, as shown in Fig. 1. All phantom studies yielded images without artifacts and with resolution of motion across the respiratory cycle (not shown).
In vivo studies were performed on 10 normal volunteers (males, 24-36 years old) and an 11-kg mongrel dog. Five volunteers were studied during normal breathing, and the other five were instructed to breathe evenly with a target rate of eight breaths per minute (or 3-4 s to inhale and 3-4 s to exhale). The normal-breathing subjects were studied with the SSFP cine sequence, for anatomic and mechanical-functional studies of the myocardium. For all coached-breathing subjects, experiments were performed with both the SSFP sequence and a through-plane PC velocity imaging sequence to measure volumetric blood flow rates. The respiratory phase for all experiments was calculated using the bellows signal, as shown in Fig. 1. The bellows was placed at the level of the umbilicus. For all experiments, segments of k-space were acquired repeatedly for 6-8 s to ensure that complete respiratory cycles were sampled. The SSFP experiments had a total acquisition time of 48-64 s per slice. Complementary end-expiration breath-hold images were acquired for all free-breathing experiments using retrospective rebinning with identical interpolation kernels (in the cardiac-phase dimension) to allow for direct comparison with free-breathing results. The cardiorespiratory-resolved radial PC protocol was used to measure volumetric blood flow rates in the ascending Ao, PA, and IVC above the level of the renal and mesenteric branches in all volunteers. Volumetric blood flow rates were calculated by integrating the flow rates over the complete cardiac cycle for each respiratory phase, yielding respiratory-resolved stroke volumes. Again, complementary end-expiration breath-held images were also acquired for each experiment. We corrected the background phase for all velocity images by fitting the time-invariant image phase with a low-order 2D polynomial spatial phase map, which was subsequently subtracted from all time frames. The bellows and ECG signals were recorded for all studies for retrospective gating. All image reconstruction was performed offline using in-house-developed software written in the MATLAB environment.
The animal study was designed to reverse the effects of respiration on cardiovascular function. Positive-pressure ventilation has an associated positive thoracic pressure during inspiration, in contrast to normal breathing, which has negative inspiratory pressure. An 11-kg dog was anesthetized with 1.5% isoflurane for the duration of a free-breathing scan. The animal was instrumented with a right atrial-pacing electrode using fluoroscopic guidance. The pacing electrode was used both for pacing and sensing cardiac rhythm. An arterial line for monitoring arterial pressure and a venous line for administering fluids were also used. The minute ventilation (∼1.8 L/min) was varied such that blood CO2 and pH were within 30-40 mmHg and 7.34-7.43 respectively. The animal was paced at 100 beats per minute (bpm) and the breathing rate was set to 10 breaths per minute.
RESULTS
Figure 2a displays typical bellows and ECG waveforms recorded during a coached free-breathing SSFP experiment. The volunteer had a respiratory rate of ∼8 breaths per minute and heart rate of ∼60 bpm. The distribution of the cardiac and respiratory phases for a representative segment of k-space from this experiment is shown in Fig. 2b (circles). The data in this scatter plot were acquired from a single breathing cycle, corresponding to the gray region in Fig. 2a. Two sample series of images were reconstructed from this free-breathing data set along the paths indicated by the squares in the cardiorespiratory phase space in Fig. 2b. The vertical path represents a series of end-diastolic images over a respiratory cycle, and the horizontal path represents a series of images at end-expiration over a cardiac cycle. The implementation of the interpolation kernel, wi, shown in Fig. 2b, is outlined in the Appendix. Figure 3a displays end-diastolic short-axis SSFP images reconstructed at 12 respiratory phases, corresponding to the vertical phase-path in Fig. 2b. For this image series, the αcard and αresp values used for regridding the k-space data in cardiorespiratory phase space were set to 0.5 and 1.0, respectively (see Appendix). As shown in Fig. 2b, the kernel on the vertical path is wider in the cardiac-phase dimension, which is designed to take advantage of the limited motion of the heart during late diastole. Six sample cardiac phases from the same data set along the horizontal phase path, which correspond to end-expiratory breath-hold-like images, are shown in Fig. 3b. The αcard and αresp values were set to 2.0 and 0.75, respectively, for the cardiac-resolved images. Again, an asymmetric kernel that was wider in the respiratory-phase dimension was used to take advantage of the limited motion in the heart during end-expiration (12,13). The asymmetric weightings for both cases shown in Fig. 2b are designed to optimize the signal-to-noise ratio (SNR) by including the maximum amount of contributing data while maintaining resolution in the cardiac and respiratory phase dimensions. The experiment was repeated with identical sequence parameters during a breath-hold with the reconstruction of six identical cardiac phases, as shown in Fig. 3c. Conventional retrospective gating was implemented for the breath-hold studies, in which each segment of k-space was repeated for a period that was approximately 20% longer than the subjects’ average cardiac period. While only six representative phases are displayed in Fig. 3b and c, an arbitrary number of phases can be reconstructed with the true temporal frequency content determined by the sampling rate, equal to TR*views per segment, and the frequency response of the interpolation kernel. Note that the kernel can sample data from sequential heartbeats, as shown in Fig. 2b, which can increase the effective temporal resolution (at the expense of potential respiratory blurring). Visual inspection of the images in Fig. 3b and c highlight the ability of the cardiorespiratory-resolved approach to freeze the respiratory motion and thus generate breath-hold-like cine images with negligible artifacts. While a sinc-Gaussian kernel was used for cardiorespiratory rebinning of the images in Fig. 3, similar image quality and SNR were observed for a variety of kernels, including a Gaussian and simple linear kernel, with 1/Di weighting. Comparatively, simple linear interpolation in a single direction, as used with the TRIADS approach (9), yielded significantly reduced SNR levels for kernels with the same frequency response. This improvement in SNR is a function of the kernel used to rebin data in the cardiorespiratory phase space. For a linear kernel with 1/Di weighting and with αcard = 1.0 and αresp 0.5 there is ∼50% increase in SNR as compared to the same kernel applied only in the cardiac-phase dimension, with similar overall image quality.
FIG. 3.
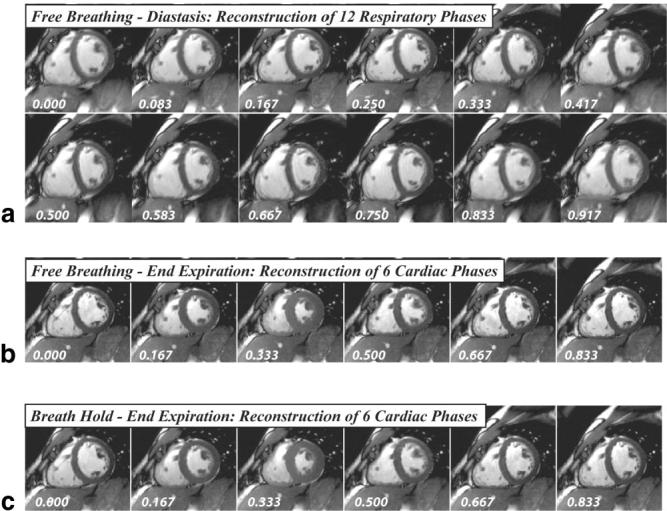
a: A series of 12 short-axis SSFP images reconstructed from a free-breathing acquisition along the vertical line shown in b. The images are reconstructed at a static cardiac phase (0.75) and the full span of respiratory phases (from 0 to 1). b: Six breath-hold-like images reconstructed from the same free-breathing acquisition, along the horizontal line in b. c: The same six cardiac phases from a separate breath-hold acquisition for the same slice orientation.
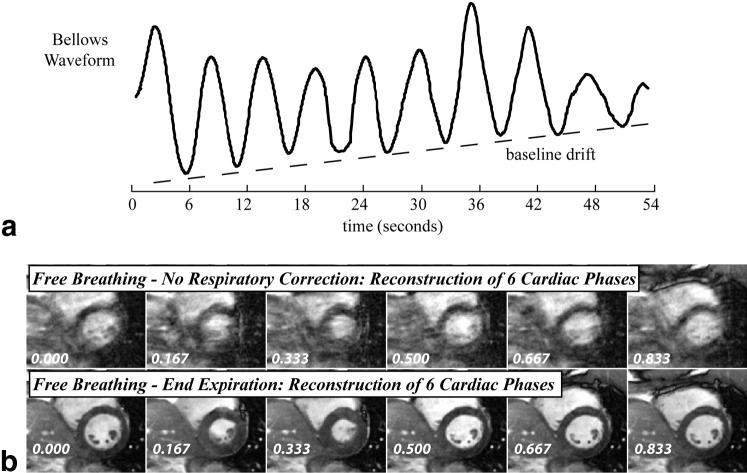
Figure 4 shows diastolic tracings of the LV epicardium and endocardium, and the right ventricular (RV) epicardium at respiratory phases of 0.25 and 0.75 (from Fig. 3a), and clearly illustrates the bulk motion and deformation of the LV and RV due to respiration. The changes in the cross-sectional area of the LV and RV are compared with end-expiration, which has a respiratory phase of 0.25. Similar patterns were observed in all normal volunteers, for both coached and normal breathing. However, the bulk motion and area changes of the LV and RV tended to be smaller in the normal-breathing group, most likely because their respiration was faster and had less volume and smaller pressures compared to the coached volunteers. A potential concern with free-breathing studies is the drift in breathing pattern over time, which results in nonidentical respiratory cycles over a study. While drift was not observed in the coached-breathing studies, one normal-breathing study did yield apparent drift in the breathing pattern, as observed with the bellows. In Fig. 5a a bellows waveform recorded from a normal-breathing volunteer shows a clear drift in the bellows amplitude over time that was not observed in the coached-breathing waveforms. Figure 5b shows six sample cardiac phases reconstructed from this normal-breathing study with drift. The second row is a cardiorespiratory end-expiration reconstruction, corresponding to the horizontal line in Fig. 2b, and the top row is a free-breathing reconstruction without consideration of respiratory phase. It is clear from the end-expiration reconstruction that the drift in breathing pattern did not have a significant effect on the image quality, which is significantly improved compared to the normal free-breathing images. End-expiration cine images of similar quality were reconstructed from all five normal-breathing volunteers.
FIG. 4.
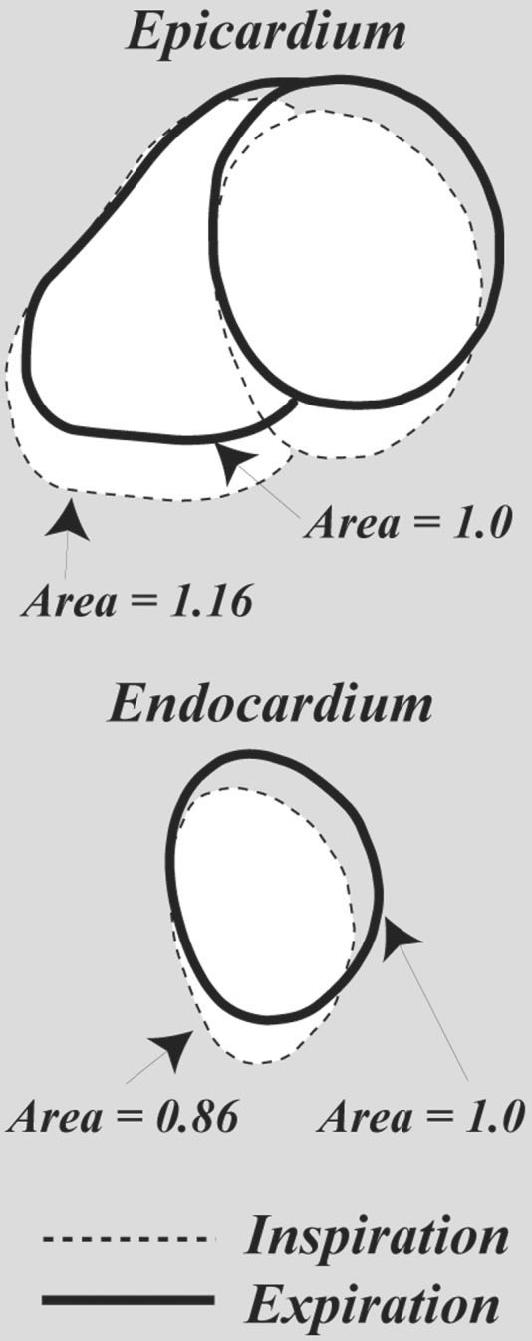
Tracings of the epicardium and endocardium from short-axis SSFP images at respiratory phases of 0.25 and 0.75, from Fig. 3a. The LV inspiration-phase image (dashed line) has a relative cross-sectional area of 0.86 as compared to the expiratory image (solid line), while the same ratio for the RV yielded a ratio of 1.16.
FIG. 5.
a: A bellows waveform recorded from a volunteer with a noticeable drift in his breathing pattern. b: SSFP cine image data acquired during these breathing cycles were reconstructed without and with respiratory binning. Six cardiac phases out of 20 reconstructed images are shown. The phase of each image is shown in the figure.
Figure 6 shows the results from a free-breathing PC study in the ascending Ao, with the axial slice prescription shown in Fig. 6a. PC images at a single systolic phase and 10 respiratory phases are shown in Fig. 6b. This series of images were reconstructed along a vertical path in cardiorespiratory phase space, as shown in Fig. 3b. Thirty full cardiac cycle images were reconstructed for each of these 10 respiratory phases, and the stroke volume for each respiratory phase was calculated. The measured stroke volume is shown in Fig. 6c as a function of respiratory phase. The cardiac phase to order reconstruction (CAPTOR) model of the cardiac cycle (14) was used to account for changes in heart rate with breathing. CAPTOR assigns the variations in the RR interval primarily to changes in diastolic duration. Because the heart rate will vary as a function of respiration, retrospective gating without a correction scheme, such as CAPTOR, will give rise to false variations in cardiac output due to apparent variations in the duration of systole. Figure 7 shows the variation in total output (ml/min) in the IVC, PA, and Ao from a different volunteer as a function of breathing. Three cycles of breathing are displayed here to provide a sense of the relationship between flow patterns in these three great vessels. For all PC experiments the αcard and αresp values were set to 1.0. Table 1 summarizes the respiratory-resolved cardiac output measurements from five normal volunteers. With deep breathing at seven to 10 breaths per minute, there was a significant variation in volumetric flow rates in the ICV, PA, and ascending Ao in all subjects. The largest respiratory modulation of blood flow was observed in the IVC, with a peak flow rate near the end of inspiration. The peak cardiac output of the right heart was delayed slightly in the respiratory cycle as compared to the flow in the IVC, and with a smaller total variation. The peak cardiac output of the left heart occurred significantly later, during expiration, and had a smaller variation than was observed in the PA and IVC. The mean output for all three vessels from the five volunteers, measured during free-breathing and a breath-hold, are shown in Table 1. The breath-hold values are in moderately good agreement with the end-expiratory values.
FIG. 6.
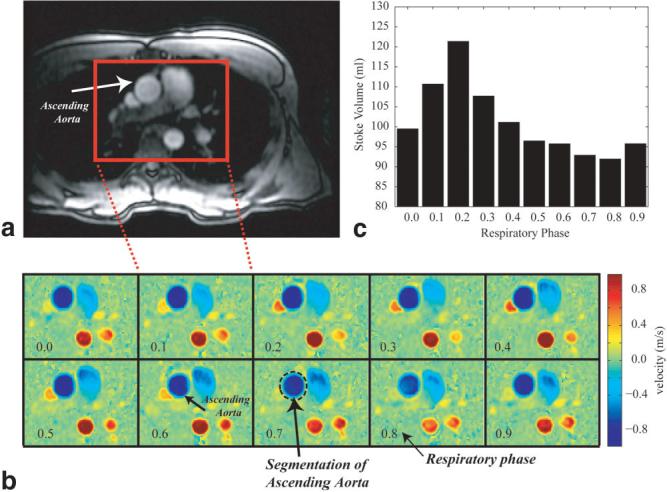
a: Axial slice prescription for a free-breathing PC study in the ascending Ao of a normal volunteer. b: PC images for the rectangular region shown in the slice prescription image (a) at a single systolic phase and 10 respiratory phases. c: The stroke volume for each of the 10 respiratory phases shown in b, each of which was calculated by integrating the flow from all of 30 cardiac phases.
FIG. 7.
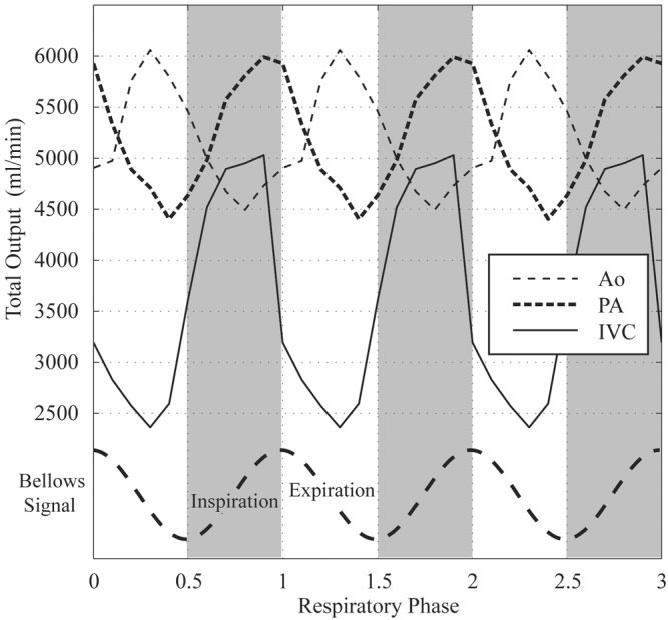
Variation in blood flow per minute in the IVC, PA, and Ao in a normal volunteer as a function of respiratory phase. Three cycles of breathing are displayed to provide a sense of the relationship among flow patterns in these three great vessels.
Table 1.
Respiratory Modulation of Volumetric Flow Rates in the Great Vessels
| IVC | Pulmonary artery | Aorta | |
|---|---|---|---|
| COmax/COmina | 1.85 ± 0.29 | 1.36 ± 0.15 | 1.24 ± 0.09 |
| Phase of COmaxb | -0.10 ± 0.05 | -0.05 ± 0.06 | 0.25 ± 0.10 |
| COend expiration (ml/min) | 3215 ± 712 | 4723 ± 254 | 5514 ± 342 |
| CObreath hold (ml/min) | 3001 ± 349 | 4888 ± 554 | 5631 ± 442 |
CO (cardiac output) is the blood volume flow per minute in the specified vessel.
Phase refers to the respiratory phase, where a complete cycle is 1.0 units.
To further study the effects of respiration on volumetric blood flow rates, we repeated the three-vessel study in a positive-pressure ventilated dog. The slice orientation for the IVC study is shown in Fig. 8a. Figure 8b displays 10 sample PC images at 10 respiratory phases during a single diastolic cardiac phase, which is similar to the vertical cardiorespiratory path shown in Fig. 3b. The total volumetric flow per heartbeat at each of the 10 respiratory phases is shown in Fig. 8c. There is a striking reduction in flow during the inspiration, or more accurately “inflation,” of the dog lungs. The total outputs from the IVC, PA, and Ao for this study, over three breathing cycles, are shown in Fig. 9. A direct comparison of Fig. 7 (free-breathing) and Fig. 9 (positive-pressure ventilation) clearly shows a reversal of the dependence on respiratory phase for all three vessels.
FIG. 8.
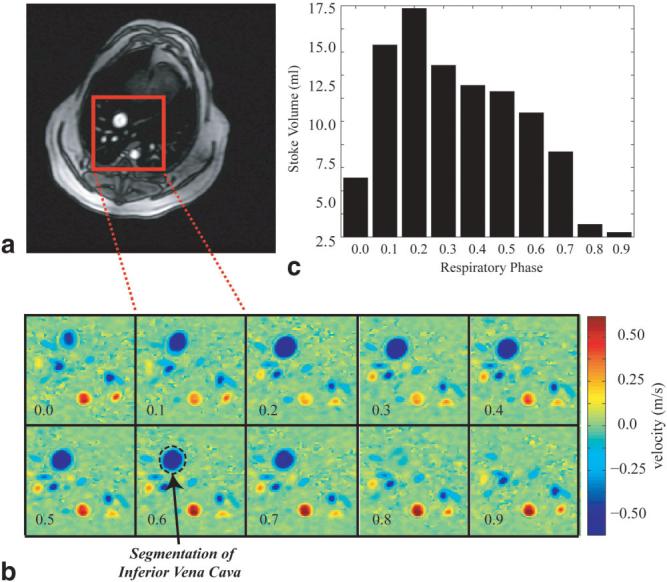
a: Axial slice prescription for a free-breathing PC study in the canine IVC. b: PC images for the rectangular region shown in the slice prescription image (a) at a single systolic phase and 10 respiratory phases. c: The stroke volume for each of the 10 respiratory phases shown in b, each of which was calculated by integrating the flow from all of 30 cardiac phases.
FIG. 9.
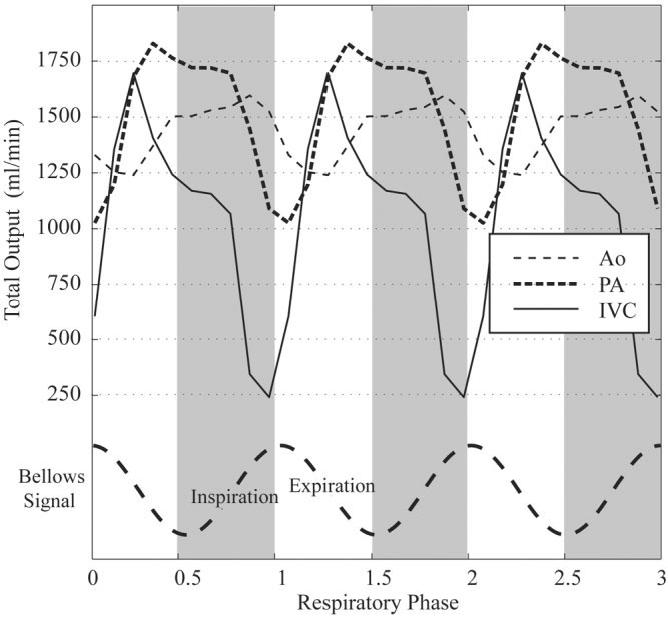
Variation in blood flow per minute in the canine IVC, PA, and Ao as a function of respiratory phase. Three cycles of breathing are displayed to provide a sense of the relationship among flow patterns in these three great vessels.
DISCUSSION
An acquisition and reconstruction technique for cardiac- and respiratory-resolved MRI has been described. Retrospectively gated, segmented pulse sequences were used without modification from their conventional cardiac-resolved mode, except for the longer total acquisition period used to sample complete respiratory cycles. This retrospective approach ensured that no real-time measurements or calculations were required to control data acquisition, and no changes to the pulse sequences were necessary. A Cartesian SSFP pulse sequence was used to image cardiac anatomy and mechanical function in short-axis images, and a radial PC sequence was used to measure volume blood flow rates in the IVC, PA, and Ao—all during free-breathing studies.
For all volunteer studies, images were successfully reconstructed with resolution of both cardiac and respiratory phase for both normal free-breathing and deeper coached-breathing patterns. The most commonly observed artifact was a slight blurring of images reconstructed in the respiratory dimension during the active inspiration and expiration periods, which most likely represents insufficient sampling in this dimension. For example, for a heart rate of 60 bpm, the respiratory cycle will only be sampled once per second, which most likely will not be adequate to capture all components of respiratory motion during inspiration or expiration. End-inspiration and -expiration images, on the other hand, typically appeared as sharp as the corresponding breath-hold image. PC images, which were acquired to measure through-plane flow in multiple great vessels, were all sufficient to quantify volumetric flow rates as a function of respiration, with no apparent image artifacts. Cine images were acquired in less than 1 min of free breathing, and the PC images were acquired in approximately 2 min; therefore, all of these acquisitions are clinically applicable.
Physiological variations of interest in this study were primarily volumetric rates of blood flow in great vessels; however, gross changes in the RV and LV volume are directly related to these flow rates and are also illustrated. End-diastolic LV volume is reduced during inspiration compared to expiration as measured on short-axis images, in agreement with PC volumetric results. Ventricular interaction might be expected to lead to RV and LV volume changes due to breathing that is 180° out of phase, such that when the RV has maximal increased end-diastolic volume, the LV has minimal volume, and vice-versa (15). However, as shown in Table 1, the phase shift between the peak output of the right and left heart is 0.3 normalized units, or ∼100°. This shift is also clearly displayed in the volumetric flow diagrams (Figs. 7 and 9) for the normal volunteers and the positive-pressure ventilated canine. This phase shift most likely represents the cumulative effects of multiple sources, including direct ventricular interaction, variations in LV preload due to the variable right heart output, and variations in LV afterload, so it is not surprising that it is not a simple 180° relationship. Other aspects of respiratory modulation of blood flow observed in this study confirm previous invasive studies. For example, it is well known that negative intrathoracic pressures during inspiration will increase venous return to the right heart, which is clearly illustrated by results in this study. The low pressures in the venous system make flow in these vessels more susceptible to changes in thoracic pressures compared to the higher-pressure arterial system. The average ratio of peak to minimum flow in the IVC was 1.85 ± 0.29 over the five volunteers, with the peak flow occurring during inspiration, at a respiratory phase that was 10% of the cycle prior to end-inspiration. Since flow in the IVC and SVC affects the preload of the right heart, the peak output from the RV is expected to occur directly after the ICV peak, at just 5% of the respiratory cycle prior to end-inspiration. The respiratory modulation of total flow was significantly smaller for the RV, with a ratio of 1.36 ± 0.15 between peak and minimum output. The dampening of the respiratory modulation in flow further downstream from the IVC to the RV may reflect the compliance of the venous system and right atrium, and a nonlinear dependence of the RV stroke volume on right atrial volume. Even further downstream, the output of the left heart had a further reduction in respiratory modulation, with a ratio of 1.24 ± 0.09 between the peak and the minimum output. The peak output for the left heart was reached at 25% of the respiratory cycle, during expiration. Again, dampening of the respiratory modulation in flow further downstream from the RV to the LV reflects the compliance of the pulmonary venous system and left atrium. These volumetric flow-rate findings agree with the variations in chamber volumes observed in the corresponding short-axis cines. Specifically, the RV end-diastolic volume is largest during inspiration, and the LV end-diastolic volume is largest during expiration. Similar findings were reported in studies that used real-time imaging during free breathing to observe ventricular septal motion (3,4).
The positive-pressure ventilated dog responded to respiration with a reversal of all flow patterns as compared to the free-breathing studies (i.e., the ICV and PA output was reduced during inspiration, while the left heart had increased output during this high-thoracic-pressure period). Because the geometric changes are similar for both positive and negative pressure inspiration, these studies confirm that thoracic pressures (as opposed to lung volume or heart position) play the primary role in modulating cardiac function. Because the dog was ventilated at a relatively slow rate of 10 breaths per minute, a large positive pressure and inflation volume were necessary to maintain blood CO2 and pH within tolerances. These large pressures resulted in almost complete cessation of venous return to the heart during inspiration, and a larger modulation in right heart output than was observed in the normal volunteers. Despite substantial respiratory modulations in the venous system, the variations in left heart output, with a peak-to-minimum ratio of 1.26, were comparable to those observed in the free-breathing normal volunteers. This very effective dampening illustrates the compliance of the venous system and the ability of the cardiovascular system to buffer against variable volume loading. The reversal of flow patterns with positive pressure ventilation was previously observed in a study using invasive flow probes (16). However, this study marks the first direct observation of respiratory modulation of flow simultaneously in the IVC and the right and left heart using MRI, for both normal and positive pressure respiration.
There are a number of limitations in the current study. First, although the gated-segmented approach provides superior spatial and temporal resolution as compared to real-time imaging, particularly for PC applications, this approach relies on the assumption of identical respiratory motion over several cycles. With this imaging approach, the inability of a subject to perform reproducible breathing may generate image artifacts (although in subjects with a documented drift in breathing patterns, there were no obvious consequences in this study). Image acceleration techniques, such as parallel imaging, could be used to reduce the free-breathing experiment duration to as few a three or four breaths, which would reduce the likelihood of variations in breathing patterns. Second, real-time and segmented approaches are both susceptible to the effects of breathing displacement of tissue in the form of through-plane motion, rotations, and deformations, which have the potential to give rise to apparent changes in anatomic dimension or flow rates that are purely geometric. This concern originally motivated the animal study in this project, which was designed to maintain geometric deformations while reversing pressure-modulated events. For all PC studies the corresponding magnitude images did not yield large apparent changes in vessel location or shape, so we suspect that orientation-related contamination of true flow rates is minimal. Finally, the relationship between the flow rates in the IVC, PA, and Ao were reported in terms of respiratory phase, which assumes that all changes will scale with changes in respiratory rate. Because the variations in right heart output would be expected to modulate the left heart preload, with some delay in time due to the transit time of the blood thought the pulmonary system, a more accurate description of the relationship between the output of the left and right heart may be an absolute temporal delay as opposed to a phase relationship. All coached volunteers were breathing with a period of ∼7 s in this study, which would translate to a delay of ∼2 s, or two heartbeats, between the peak flow in the right and left heart.
MRI offers several advantages for studying the effects of respiration on cardiac mechanical function and hemodynamics. It is noninvasive, has excellent intrinsic soft-tissue contrast, and allows arbitrary slice orientations for good visualization of anatomy. Blood velocity measured with PC MRI allows volumetric rates of blood flow to be directly quantified in all great vessels without models or geometric assumptions. These fundamental functional capabilities of MRI, in combination with the free-breathing acquisition and reconstruction methods outlined in this study, will provide a useful tool for quantifying cardiac anatomy and function as a function of respiration, for both normal breathing and positive-pressure ventilation.
APPENDIX
Equation [A1] relates the k-space value at a target location in cardiac and respiratory phase space, kn, to an interpolation kernel, fkernel, and the neighboring acquired k-space data, kni:
| [A1] |
The distance term in the kernel, Di, is a function of the distances between the acquired k-space data and target reconstruction location in both the cardiac and respiratory phase directions, di(card) and di(resp). The distances, di, are fractions of the cardiac or respiratory cycles according to the units shown in Fig. 2b, and thus are always between -1 and 1. In Eq. [A2] below, the factors αcard and αresp accommodate asymmetric weighting of k-space data in the cardiac- and respiratory-phase directions in the interpolation kernel. These variables allow the reconstruction to take advantage of potential asymmetry in cardiac and respiratory temporal frequency information:
| [A2] |
A sinc-Gaussian kernel with a full width at half maximum (FWHM) value of 0.05 phase units was used for all displayed results in this study (fkernel = sinc(20Di)*exp(-(20Di)2). When evaluated with α values of 1.0, this kernel has negligible contributions from beyond 5% of the cardiac or respiratory cycles relative to the targeted cardiac and respiratory phase. In general, the width of the kernel must be selected based on the data-sampling density in cardiorespiratory phase space, where the minimum width is determined by the minimum distance between samples.
REFERENCES
- 1.Hatle LK, Appleton CP, Popp RL. Differentiation of constrictive pericarditis and restrictive cardiomyopathy by Doppler echocardiography. Circulation. 1989;79:357–370. doi: 10.1161/01.cir.79.2.357. [DOI] [PubMed] [Google Scholar]
- 2.Sakuma H, Kawada N, Kubo H, Nishide Y, Takano K, Kato N, Takeda K. Effect of breath holding on blood flow measurement using fast velocity encoded cine MRI. Magn Reson Med. 2001;45:346–348. doi: 10.1002/1522-2594(200102)45:2<346::aid-mrm1044>3.0.co;2-i. [DOI] [PubMed] [Google Scholar]
- 3.Francone M, Dymarkowski S, Kalantzi M, Bogaert J. Real-time cine MRI of ventricular septal motion: a novel approach to assess ventricular coupling. J Magn Reson Imaging. 2005;21:305–309. doi: 10.1002/jmri.20259. [DOI] [PubMed] [Google Scholar]
- 4.Francone M, Dymarkowski S, Kalantzi M, Rademakers FE, Bogaert J. Assessment of ventricular coupling with real-time cine MRI and its value to differentiate constrictive pericarditis from restrictive cardiomyopathy. Eur Radiol. 2005:1–8. doi: 10.1007/s00330-005-0009-0. [DOI] [PubMed] [Google Scholar]
- 5.Thompson RB, McVeigh ER. Real-time volumetric flow measurements with complex-difference MRI. Magn Reson Med. 2003;50:1248–1255. doi: 10.1002/mrm.10637. [DOI] [PMC free article] [PubMed] [Google Scholar]
- 6.Eichenberger AC, Schwitter J, McKinnon GC, Debatin JF, von Schulthess GK. Phase-contrast echo-planar MR imaging: real-time quantification of flow and velocity patterns in the thoracic vessels induced by Valsalva’s maneuver. J Magn Reson Imaging. 1995;5:648–655. doi: 10.1002/jmri.1880050606. [DOI] [PubMed] [Google Scholar]
- 7.Hjortdal VE, Emmertsen K, Stenbog E, Frund T, Schmidt MR, Kromann O, Sorensen K, Pedersen EM. Effects of exercise and respiration on blood flow in total cavopulmonary connection: a real-time magnetic resonance flow study. Circulation. 2003;108:1227–1231. doi: 10.1161/01.CIR.0000087406.27922.6B. [DOI] [PubMed] [Google Scholar]
- 8.van den Hout RJ, Lamb HJ, van den Aardweg JG, Schot R, Steendijk P, van der Wall EE, Bax JJ, de Roos A. Real-time MR imaging of aortic flow: influence of breathing on left ventricular stroke volume in chronic obstructive pulmonary disease. Radiology. 2003;229:513–519. doi: 10.1148/radiol.2292020559. [DOI] [PubMed] [Google Scholar]
- 9.Fredrickson JO, Wegmuller H, Herfkens RJ, Pelc NJ. Simultaneous temporal resolution of cardiac and respiratory motion in MR imaging. Radiology. 1995;195:169–175. doi: 10.1148/radiology.195.1.7892461. [DOI] [PubMed] [Google Scholar]
- 10.Lenz GW, Haacke EM, White RD. Retrospective cardiac gating: a review of technical aspects and future directions. Magn Reson Imaging. 1989;7:445–455. doi: 10.1016/0730-725x(89)90399-8. [DOI] [PubMed] [Google Scholar]
- 11.Barger AV, Peters DC, Block WF, Vigen KK, Korosec FR, Grist TM, Mistretta CA. Phase-contrast with interleaved undersampled projections. Magn Reson Med. 2000;43:503–509. doi: 10.1002/(sici)1522-2594(200004)43:4<503::aid-mrm3>3.0.co;2-0. [DOI] [PubMed] [Google Scholar]
- 12.Shechter G, Resar JR, McVeigh ER. Rest period duration of the coronary arteries: implications for magnetic resonance coronary angiography. Med Phys. 2005;32:255–262. doi: 10.1118/1.1836291. [DOI] [PMC free article] [PubMed] [Google Scholar]
- 13.Shechter G, Ozturk C, Resar JR, McVeigh ER. Respiratory motion of the heart from free breathing coronary angiograms. IEEE Trans Med Imaging. 2004;23:1046–1056. doi: 10.1109/TMI.2004.828676. [DOI] [PMC free article] [PubMed] [Google Scholar]
- 14.Feinstein JA, Epstein FH, Arai AE, Foo TK, Hartley MR, Balaban RS, Wolff SD. Using cardiac phase to order reconstruction (CAPTOR): a method to improve diastolic images. J Magn Reson Imaging. 1997;7:794–798. doi: 10.1002/jmri.1880070505. [DOI] [PubMed] [Google Scholar]
- 15.Mitchell JR, Whitelaw WA, Sas R, Smith ER, Tyberg JV, Belenkie I. RV filling modulates LV function by direct ventricular interaction during mechanical ventilation. Am J Physiol Heart Circ Physiol. 2005;289:H549–557. doi: 10.1152/ajpheart.01180.2004. [DOI] [PubMed] [Google Scholar]
- 16.Pinsky MR. Determinants of pulmonary arterial flow variation during respiration. J Appl Physiol. 1984;56:1237–1245. doi: 10.1152/jappl.1984.56.5.1237. [DOI] [PubMed] [Google Scholar]


