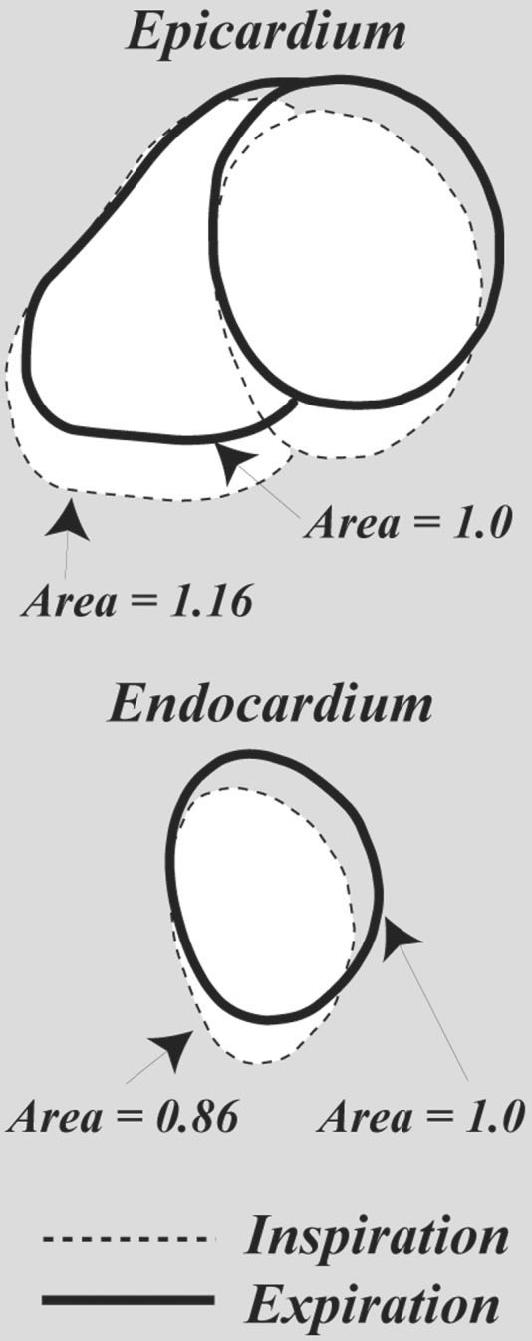
FIG. 4.

Tracings of the epicardium and endocardium from short-axis SSFP images at respiratory phases of 0.25 and 0.75, from Fig. 3a. The LV inspiration-phase image (dashed line) has a relative cross-sectional area of 0.86 as compared to the expiratory image (solid line), while the same ratio for the RV yielded a ratio of 1.16.
