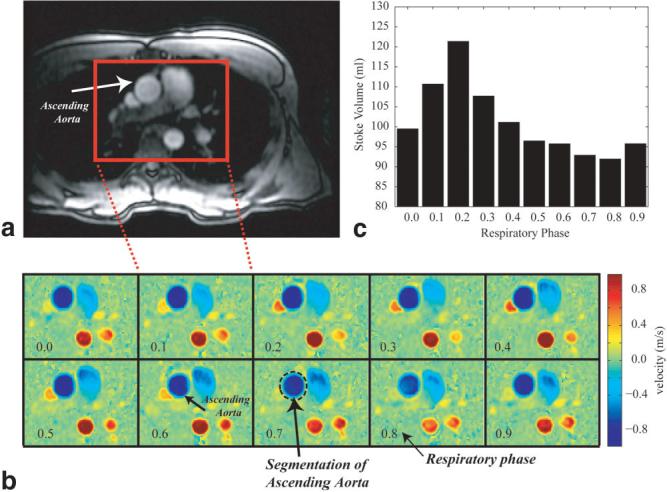
FIG. 6.

a: Axial slice prescription for a free-breathing PC study in the ascending Ao of a normal volunteer. b: PC images for the rectangular region shown in the slice prescription image (a) at a single systolic phase and 10 respiratory phases. c: The stroke volume for each of the 10 respiratory phases shown in b, each of which was calculated by integrating the flow from all of 30 cardiac phases.
