
Fig. 3.
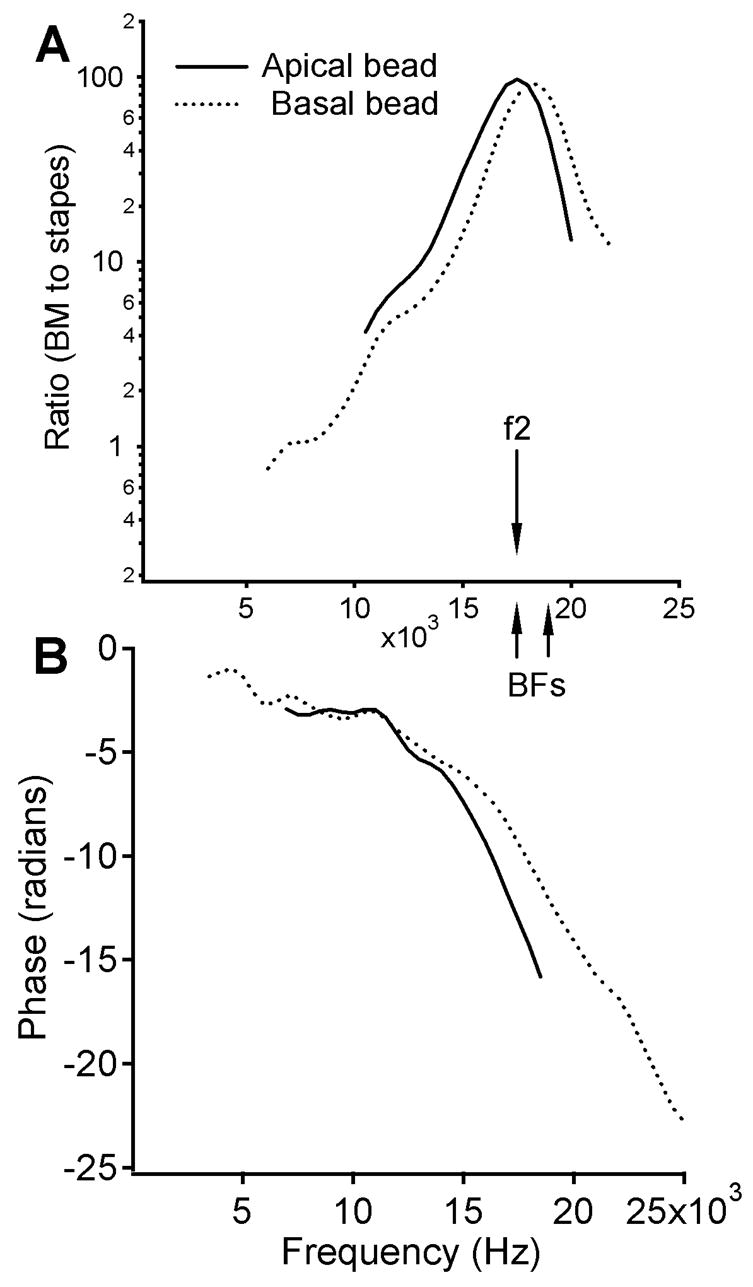
Magnitude and phase transfer functions of the BM measured at 30 dB SPL from same two longitudinal locations as for data in Fig. 2. The arrows in panel A show the relationship between the f2 and the BFs. Panel A shows that BFs of two locations are approximately 17.0 kHz for the apical bead (solid line) and 18.5 kHz for the basal bead (dotted line). The phase transfer function in panel B shows that for a given frequency the phase of the basal bead leads the phase of the apical bead, which indicates a forward traveling wave.