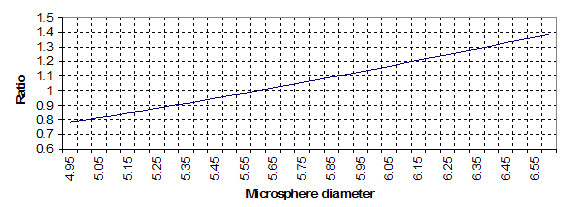
Figure 5.

Graph of the ratio of fluorescent intensity to true normal by bead size. A ratio of 1 is for a microsphere sample equal to the specified mean microsphere diameter. This shows the relationship of microsphere diameter to brightness of signal, illustrating the correspondence of brightness as an r2 relation.
