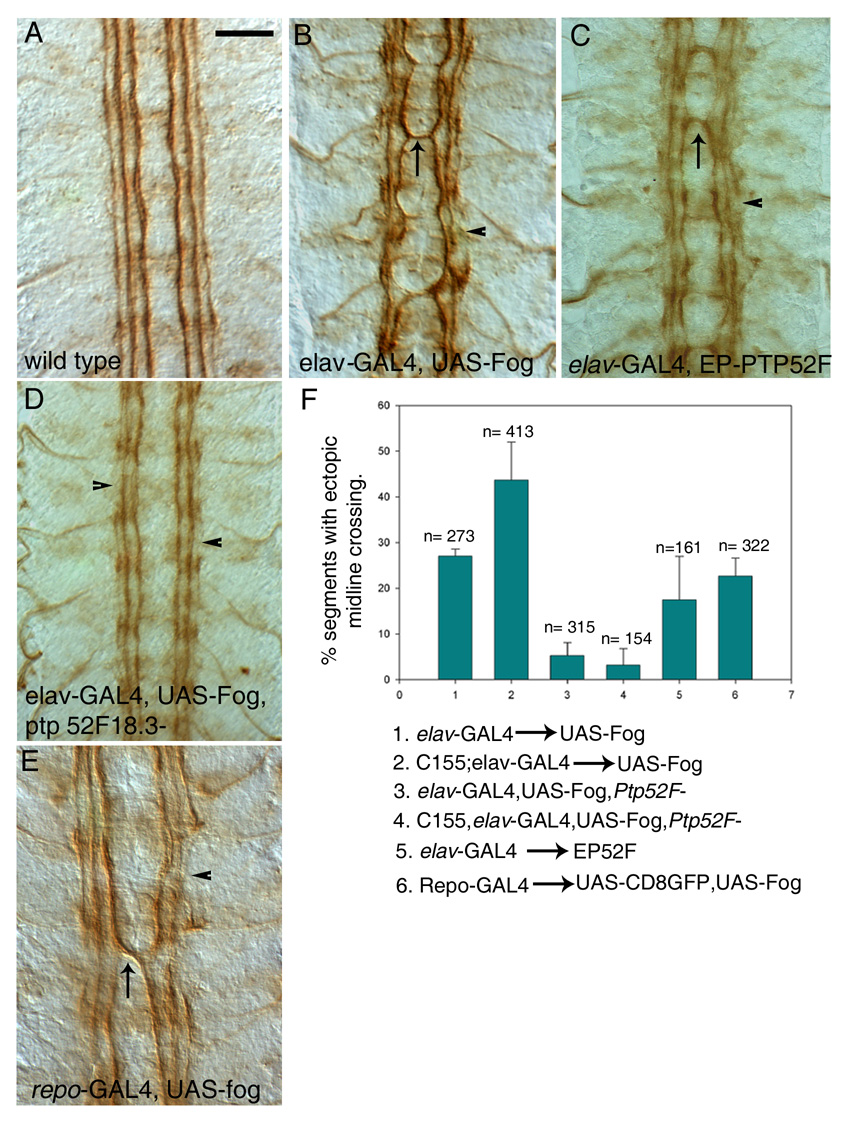
Figure 5. Fog and PTP52F CNS overexpression phenotypes, and suppression of the Fog overexpression phenotype by loss of Ptp52F function.

Late stage 16 embryos were stained with mAb 1D4 (brown) and dissected. Four segments are shown; anterior is up.
A) Wild-type (Oregon R) embryo. Note that the three 1D4-positive longitudinal axon bundles do not cross the midline.
(B) Elav-GAL4::UAS-fog. All three longitudinal bundles are disorganized, and often fused to each other. Breaks in the bundles are often present, especially in the outer bundle (arrowhead). Frequent ectopic midline crossing by the inner bundle is observed (arrow).
(C) Elav-GAL4::EP52F. A phenotype similar to (B) is observed, with occasional bundle fusions and breaks (arrowhead), and ectopic midline crossing (arrow).
(D) Elav-GAL4::UAS-fog, Ptp52F18.3/Ptp52F18.3. Removal of Ptp52F function in Fog overexpression embryos suppresses ectopic midline crossing.
(E) Repo-GAL4::UAS-fog. Ectopic midline crossing is also seen when Fog is overexpressed in glia (arrow). Breaks are frequently observed in the outer longitudinal bundles (arrowhead).
(F) Bar graph showing percentages of segments with ectopic midline crossing observed in different genotypes. The numbers above the bars indicate the number of segments scored for each genotype. Scale bar in (A), 10 µm (applies to all panels).
