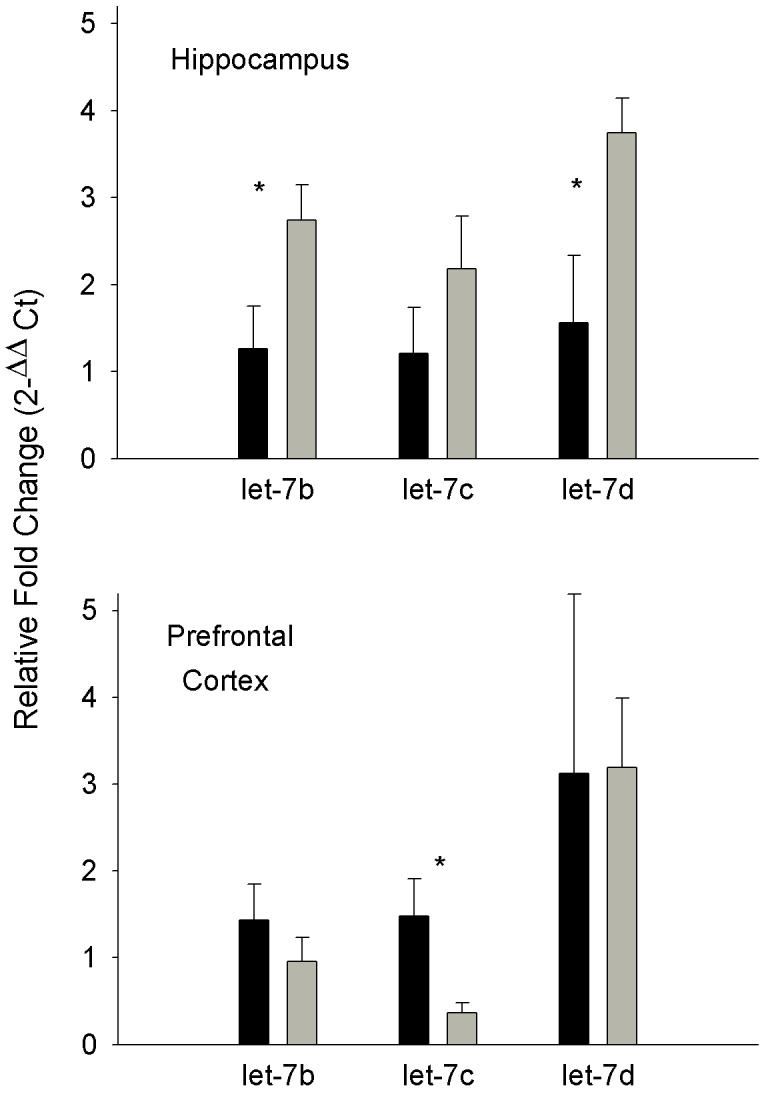
Figure 1. Primer extension-quantitative PCR of let-7 expression following sleep-deprivation.

Mean (± SEM) let-7 expression of cage controls (dark bars) and rats sleep-deprived for 8 h (light bars) in the hippocampus (upper panel; n = 11) and prefrontal cortex (lower panel; n = 8). Asterisk indicates p < 0.05.
