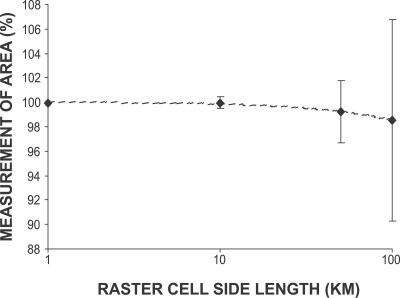
Figure 9. Variation in the Area Measurement of a Real Extent.
The area of the UK was measured from raster datasets at resolution 1, 10, 50, and 100 km, as a percentage of a vector polygon area (245,660 km2), and the mean calculated. The y-error bars denote coefficient of variation. The mean is always an underestimate, and worsens at lower resolutions.

