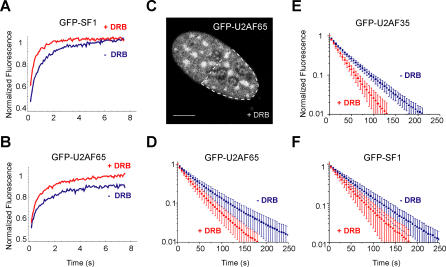
Figure 3. Splicing Proteins Are More Mobile in Cells Treated with DRB.
FRAP (A,B) and FLIP (D–F) experiments were performed on cells mock-treated (−DRB) or treated (+DRB) with DRB for 30 min. The GFP-tagged splicing proteins are indicated on each graph. For FRAP experiments, the bleached region was localized on a nuclear speckle. For FLIP experiments, the bleach region corresponded to half of the cell nucleus (dashed outline in (C), and the fluorescence decay was analyzed over a nuclear speckle. Each recovery or decay curve corresponds to a pool of three independent experiments, with ten different cells analyzed per experiment. Error bars represent standard deviations. The differences observed in the FLIP curves between DRB treated and untreated cells are statistically significant (p < 0.0001 for GFP-U2AF65 and GFP-U2AF35, and p < 0.005 for SF1).

