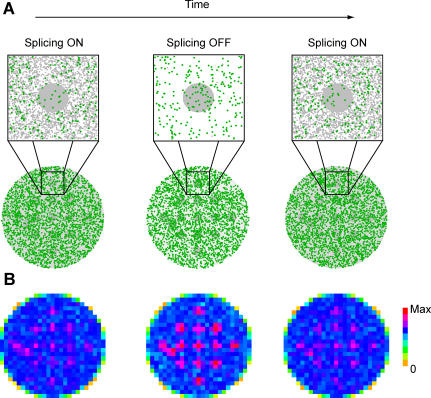
Figure 7. Modeling Splicing Protein Kinetics in the Cell Nucleus.
(A) The scheme illustrates the steady-state distribution of splicing proteins when splicing is either active (Splicing ON) or inactive (Splicing OFF). Splicing factors are represented in green and nuclear binding sites in grey. The lower row depicts positions inside the whole nucleus, and the upper row shows a zoom of the area delimited by the dashed square. The large grey circle in the upper row represents a nuclear speckle, and grey dots in the nucleoplasm represent intron-containing nascent transcripts. Note the larger number of splicing factors inside the nuclear speckle when splicing is inhibited. The parameters used for binding reactions were  = 3.28 s
−1, koff,nuc = 10 s−
1,
  = 0.045 s−1, and koff,spk = 0.066 s−
1 (Splicing ON). To model splicing inhibition, we assumed a decrease in available nucleoplasmic binding sites; accordingly, the pseudo on-rate in the nucleoplasm was decreased by a factor of approximately 30,000,
  = 10−4
s
−1.
(B) Color-code representation of the concentration of splicing factors throughout the nucleoplasm and within nuclear speckles (pink squares define dimensions and number). The simulation space corresponding to the nucleus was divided into squares (25 × 25 pixels), and the number of splicing proteins inside each square was computed (Max is the maximum value obtained in the simulations). After splicing inhibition, the number of splicing proteins at nuclear speckles is higher. Consequently, there is an increase in the local concentration (the pale pink squares become dark red) as well as in the total area occupied by highly concentrated splicing proteins (pink/red squares); this closely mimics the enlarged nuclear speckles observed in HeLa cells treated with DRB (Figure 2B and 2D) or expressing SPN1ΔN (Figure 4G).

