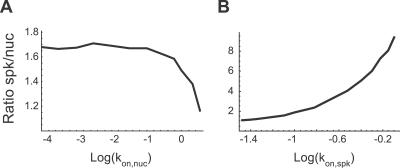
Figure 8. Influence of  and
and  on the Relative Concentration of Splicing Proteins in Nuclear Speckles.
The number of splicing proteins in a speckle and in an equivalent nucleoplasmic area was counted and their ratio calculated.
(A) The graph plots the ratio as a function of  . The ratio increases with decreasing
  values, but stabilizes below a threshold of approximately 10−1.5 s−1.
(B) The graph plots the ratio as a function of  . This ratio increases unbounded with increasing
  values.

