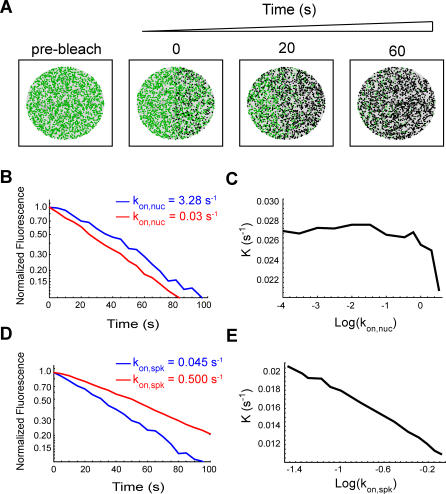
Figure 9. FLIP Simulations.
(A) Schematic illustration of a simulated FLIP sequence. The green dots represent the positions of unbleached molecules, while the black dots represent the bleached ones. The area that was repeatedly bleached corresponds to the first and the fourth quadrant of the circle that defines the nucleus. The diffusion model was run for an initial 100 s to achieve a steady state, and then a cycle of repetitive bleaching events was started. Fluorescence was monitored in the unbleached portion of the circle, both in a nuclear speckle and in a nucleoplasmic region of the same size, and at the same distance from the bleached region.
(B) FLIP decay curves were generated by counting the number of fluorescent molecules inside the monitored regions at defined time intervals. For normalization, these values are divided by the number of fluorescent molecules in those regions immediately before bleaching. Normalized FLIP curves are then fitted by an exponential function of the form: f(t) = exp(−Kt), where K is the rate of fluorescence decay. Only FLIP decay curves in the nuclear speckles are depicted. The model parameters were as follows:  = 0.045 s
−1 , koff,spk = 0.066 s−
1, koff,nuc = 10 s−
1, and
  = 3.28 s−1 (blue line) or 0.03 s−1 (red line). The decay is faster for the lower
  .
.
(C) Plot of FLIP decay rates (K) as a function of  . The decay is faster for lower
  values and stabilizes below approximately 10−1.5 s−1, which implies at least a 100-fold reduction in the concentration of nucleoplasmic binding sites.
(D) The effect of increasing  . FLIP decay curves in the speckles was obtained with the following parameters:
  = 0.045 s
−1 (blue line) or 0.5 s−1 (red line), koff,spk = 0.066 s−
1, koff,nuc = 10 s−
1, and
  = 3.28 s−1. The decay is slower for the higher
  .
.
(E) Plot of FLIP decay rates (K) as a function of  . This decay is increasingly slower for the higher values of
  .
.

