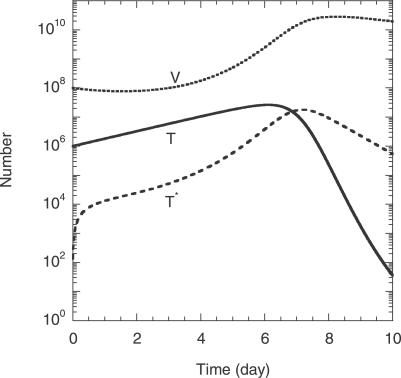
Figure 2. Model Predictions of the Overall Cell and Viral Dynamics.
The time evolution of the number of uninfected cells, T, the total number of infected cells, T*, and the total viral load, V, following the onset of infection obtained by the solution of Equations 1–6 with the following parameter values: the initial target cell number, T 0 = 106; the initial viral load, 2V 0 = 108; the birth and death rates of uninfected cells, λ = 0.624 d−1 and μ = 0.018 d−1; the death rate of infected cells, δ = 1.44 d−1; the viral burst size, N = 1,000; the clearance rate of free virions, c = 0.35 d−1; the infection rate constant of uninfected cells, k 0 = 2 × 10⁻¹⁰ d−1; the CD4 down-modulation timescale, t d = 0.28 d; the recombination rate, ρ = 8.3 × 10⁻⁴ crossovers per position; and the separation between the mutations on genomes 1 and 2, l = 408 base pairs.

