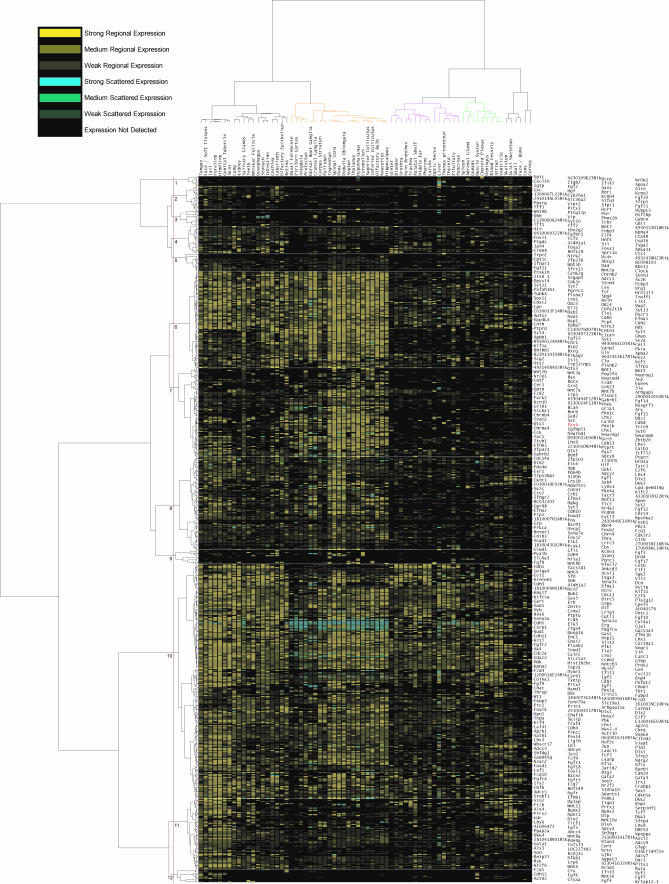
Figure 4. Cluster Analysis of Expression Pattern Annotations.
The annotation of the expression pattern for each gene at every anatomical location is represented by color (yellow for regional or ubiquitous, blue for scattered) and intensity (dark for weak expression, midtone for medium expression, and bright for strong expression). See also color key on figure. Dendrograms composed using Ward's clustering represent 70 unique anatomical structures (horizontal) and 652 genes (vertical). A total of 12 clusters/groups of genes are labeled.

