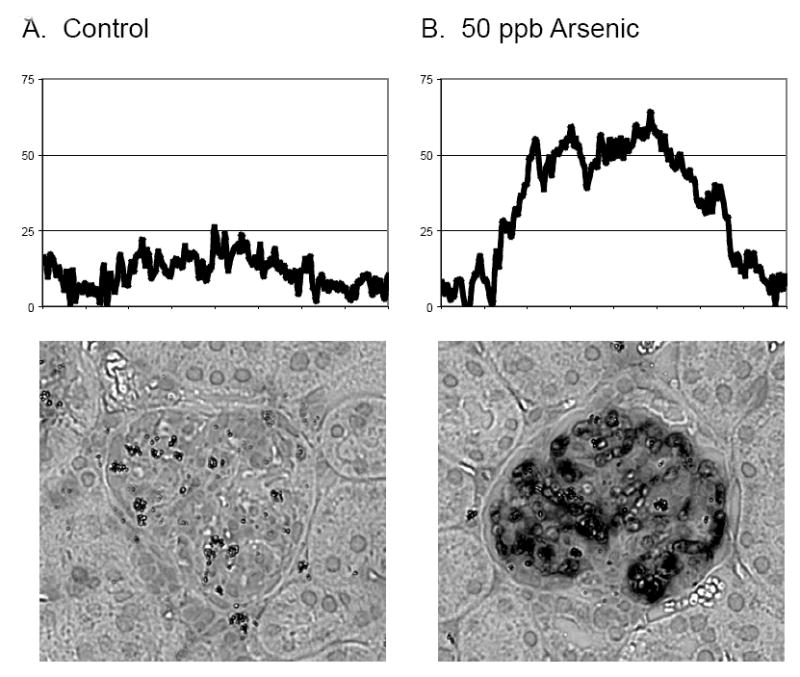
Fig. 2.

Comparison of staining intensity, and corresponding HKII II levels, in representative glomeruli from control (A) and 50 ppb arsenic exposed mice (B). Tissue sections were stained as described in figure 1. The relative intensity of staining was compared by creating 2-D densitometry plots in Scion Image. Each 8-bit, 256-grayscale image (400 pixels wide by 366 pixels in height) was first normalized to their background signal intensities. In the densitometry plots, each Y-value represents the mean staining intensity of the column of pixels directly beneath it in the corresponding image. The mean staining intensity values on the Y-axis are arbitrary units based on the numerical intensity values to each pixel according to the 256-greyscale convention of shading.
