
FIG. 1.
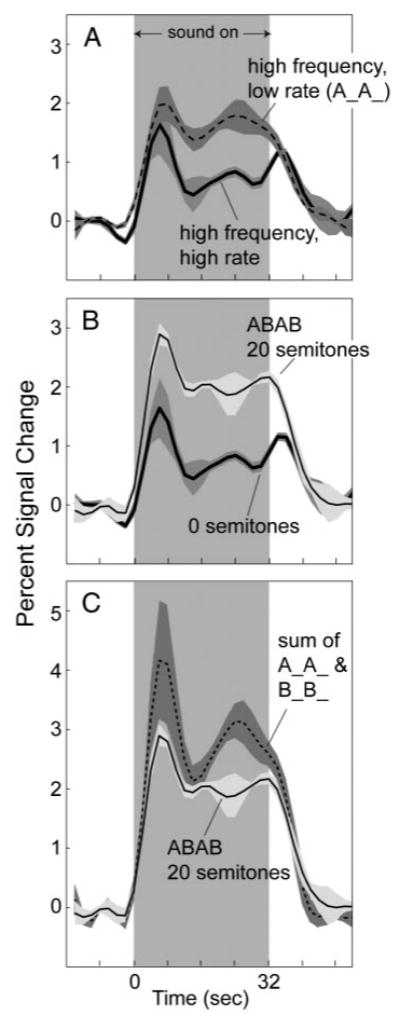
A: time course of activation on Heschl's gyrus for (A) sequences of high-frequency (1,900 Hz) tones presented at a high (10/s) and a low (5/s) rate, (B) ABAB sequences with frequency separations between A and B of 20 and 0 semitones, and (C) an ABAB, 20 semitone sequence—same as in B. C: sum of the time courses produced when the A and B tones of the 20-semitone ABAB sequence were presented separately (A__A__ and B__B__). In all panels, the traces are each an average across the 3 subjects who participated in the preliminary experiment. Time course for each subject and stimulus condition was calculated by averaging across all Heschl's gyrus voxels active (P < 0.001) for either the 0- or 20-semitone condition. Shading indicates ±1 SE. In calculating the error, each subject was considered a separate data point.