
FIG. 5.
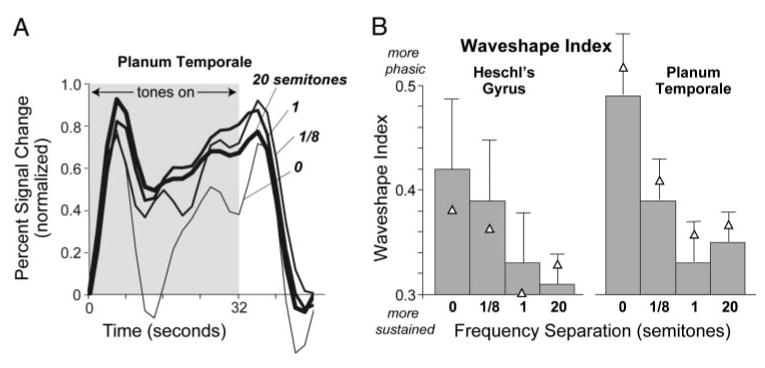
A: normalized time course of fMRI activation for 4 frequency separations. For each subject, time courses were calculated by averaging over voxels active for any frequency separation (P < 0.001). They were then normalized to have a maximum amplitude of one and, for each frequency separation, were averaged across subjects. B: time course waveshape quantified in terms of a waveshape index that ranges from 0 (most sustained) to 1 (most phasic). Each bar indicates an average across 7 subjects. Triangles indicate the mean when the values for the 2 psychophysical outliers are excluded. Error bars indicate 1 SE. Each subject was considered a separate data point.