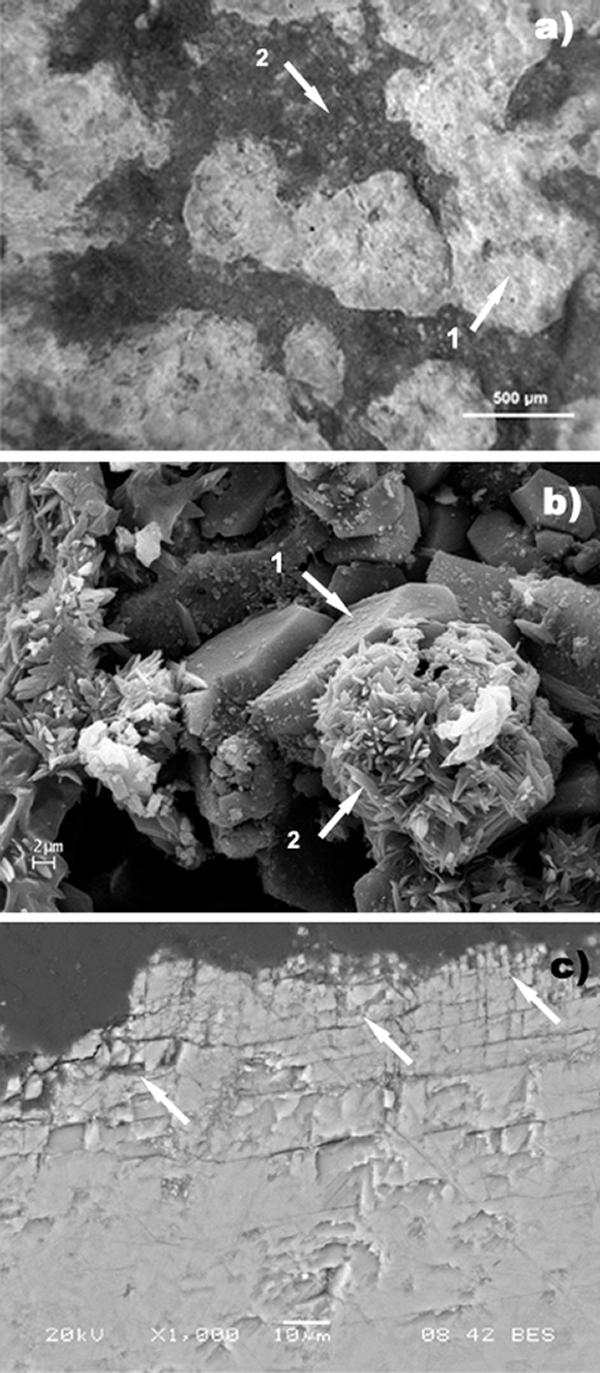
FIG. 4.

Sample 2 surface after chemical cleaning. (a) Portable microscope observation on site: nonhomogeneous surface from the cleaned area. Arrow 1, clean area; arrow 2, residual crust. (b) SEM observation. Arrow 1, tabular crystals of gypsum; arrow 2, acicular crystals of sodium sulfate. (c) SEM observation of the polished cross section (back-scattered image). The arrows indicate a noticeable network of microfractures close to the surface.
