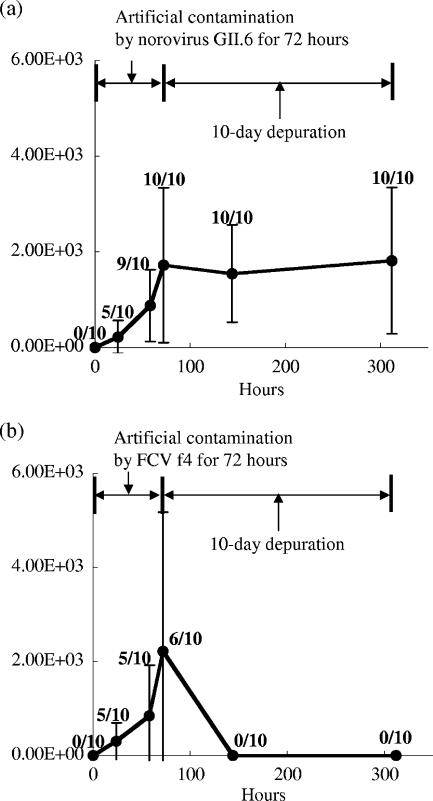
FIG. 1.
Average gene concentration (copies/g of digestive diverticulum) of norovirus GII (a) and FCV (b) in digestive diverticulum of oyster during artificial contamination by norovirus GII.6 (a) or FCV f4 (b) (0 to 72 h) and the depuration process (72 to 312 h). Ten oysters were sampled at each time point, and each oyster was assayed by real-time qRT-PCR. The error bar indicates the SD from 10 oysters in a single test of the contamination and depuration. The ratio of the number of positive samples to the number of analyzed samples is indicated above each dot.

