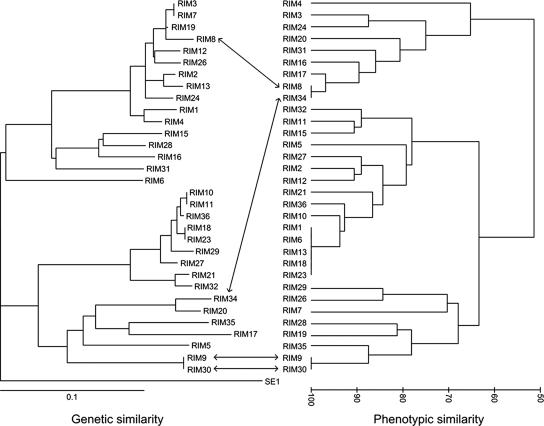
FIG. 2.
Comparison of the genetic and phenotypic similarities among the 32 cyanomyophages in this study. A neighbor-joining tree (left) illustrates the genetic similarities among phage isolates based on pairwise distances between g20 amino acid sequences (15). A cluster diagram (right) illustrates phenotypic similarities between phage isolates; phenotypic similarity is defined as the percentage of Synechococcus strains that the paired phages could either both infect or both not infect. See the text for further details. The bottom arrows illustrate a case where genotypic and phenotypic similarities are both high, whereas the top arrows highlight two phages that have a high phenotypic similarity but a low genetic similarity.

