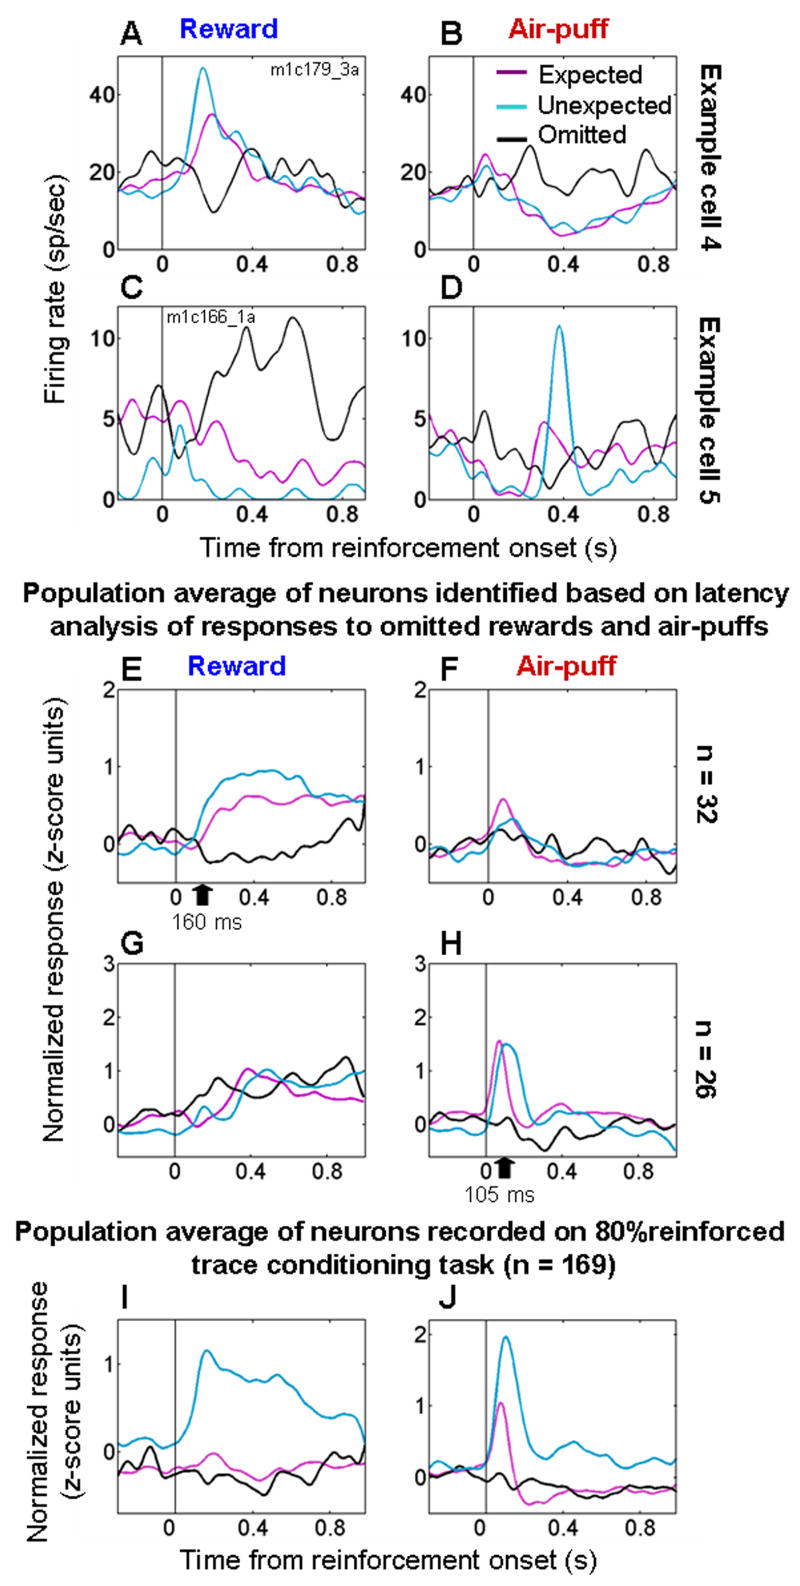
Figure 5. Neural responses to omitted reinforcement.
A,B. PSTHs from an amygdala cell showing increased firing to unexpected rewards (A) and omitted air-puffs (B), and decreased firing to air-puffs (B) and omitted rewards (A). C,D. PSTH from an amygdala cell showing increased firing to unexpected air-puffs (D) and omitted rewards (C), and decreased firing to rewards (C) and omitted air-puffs (D). E,F. Normalized and averaged population PSTHs for neurons showing evidence of decreased firing to omitted rewards and/or increased firing to omitted air-puffs (n = 32, Table 1). G,H. Normalized and averaged population PSTHs for neurons showing evidence of decreased firing to omitted air-puffs and/or increased firing to omitted rewards (n = 26, Table 1). I,J. Normalized and averaged PSTHs showing responses to rewards (I) and air-puffs (J) from all cells recorded during both the trace-conditioning task with 80% reinforcement probability and the random task (n = 169). For all plots: magenta, black, and blue curves, responses to expected, omitted, and random reinforcement, respectively. Black arrows in E and H, mean latency of decreased responses to omitted rewards and air-puffs. PSTHs smoothed with a 50 ms Gaussian.

