
Figure 7. The decrease in responses to reinforcement is correlated with the evolving representation of value in the amygdala.
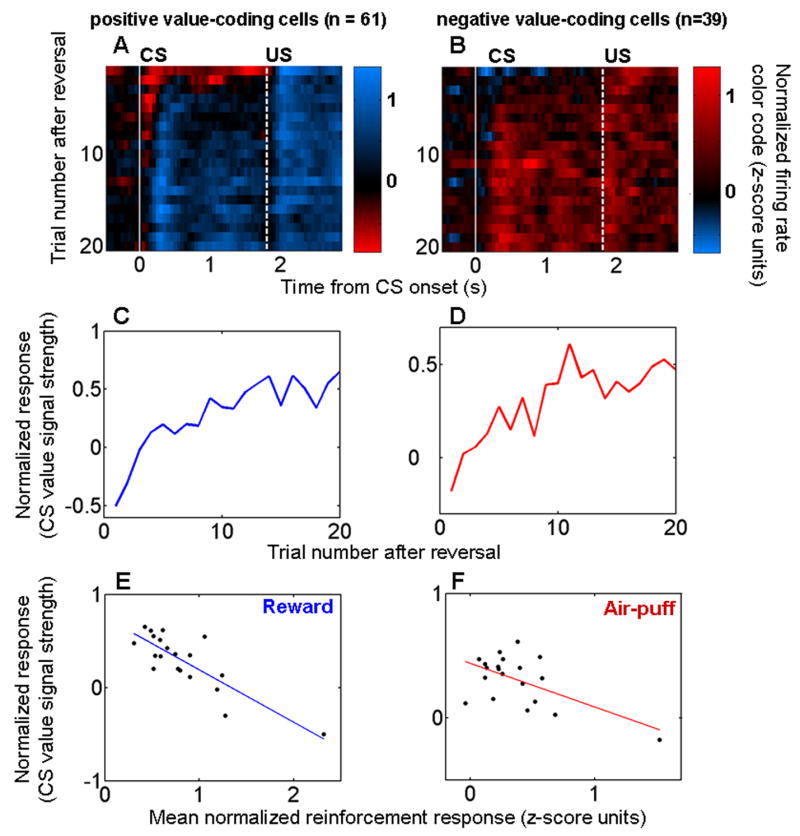
A,B. Color maps showing the representation of value during reversal learning as a function of trial number and of time within trials. Positive (A) and negative (B) CS value-coding cells from the 100% reinforcement probability trace-conditioning task shown separately. Vertical white lines, CS onset (solid line) and US onset (dashed line). Each 200 ms bin shows the difference in firing rate between rewarded and punished trials; bins were advanced in 50 ms steps. Trial 1, first trial after reversal. Bin starting at time 0, interval from 0–200 ms after CS onset. C,D. CS value-coding extracted from the color map by taking the mean value in the interval between the white lines for neurons encoding positive (C) and negative (D) CS value. E,F. Recorded reinforcement responses (data points from Figs. 6C,D) plotted against the evolution of CS value coding (data points from Figs. 7C,D) during trials 1–20 after reversal. Regression lines are shown in blue and red.