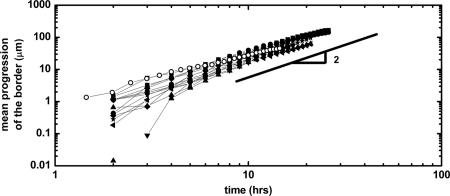
Fig. 3.
Dynamic progression of the border of the epithelium. Several experiments performed in similar conditions are reported on the same graph. For the solid symbols, initial widths range from 150 μm to 400 μm. The open symbols represent an experiment with an initial width of 100 μm. The lines are guides for the eye.

