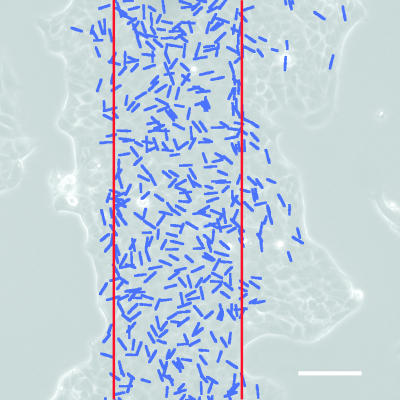
Fig. 5.
Cumulative plot of the divisions over a time course of 16 h. Each blue line indicates the position and orientation of the division. The red lines indicate the initial position of the band. A vast majority (85%) of the divisions occur in the locus of this initial band with no particular orientation (see SI Fig. 9). (Scale bar: 100 μm.)

