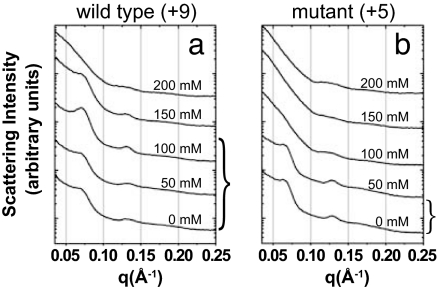
Fig. 5.
Series of diffraction data showing evolution of bundle structure as a function of NaCl concentration for WT (+9e) lysozyme–actin complexes (a) and double-mutant (+5e) lysozyme–actin complexes (b). For the WT lysozyme–actin complexes (a), the maximum bundling occurs near ≈125 mM NaCl, whereas the mutant lysozyme–actin bundling peak (b) shows a maximum at ≈50 mM NaCl.

