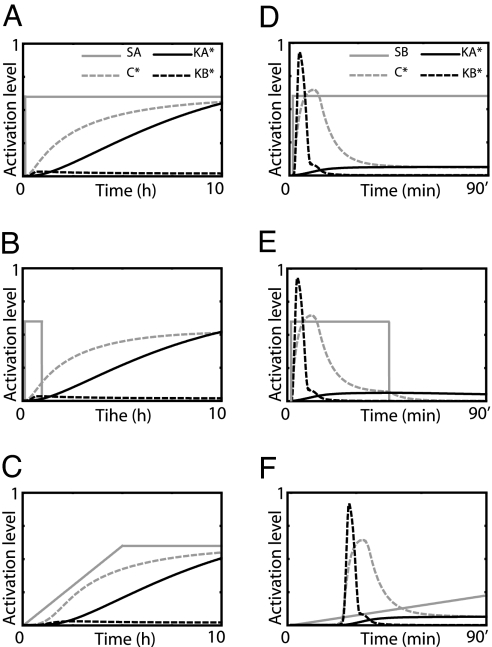
Fig. 5.
Response to various stimulus profiles. A–C illustrate the system's response to sustained, transient (45 min), and ramped stimulus profiles, respectively, applied to pathway A. Times series for the stimulus SA (gray lines) and activity levels of C (dashed gray lines), KA (black lines), and KB (dashed black lines) are shown. D–F illustrate the system's response to the same stimulus profiles applied to pathway B. The gray lines are times series for SB. Note that, for this case, both KA and KB reach steady state within 90 min.

