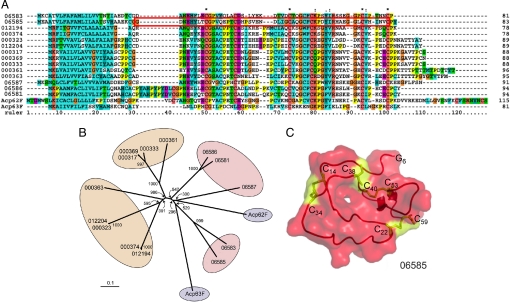
Fig. 2.
Phylogenetic analysis of serine protease inhibitors in three insect species. (A) Multiple protein sequence alignment for the D. melanogaster (Acp62F and Acp63F), An. gambiae (06587, 06586, 06585, 06583, and 06581), and Ae. aegypti (identified by the last six digits of their Ensembl entry codes omitting the AAEL code: 012194, 000374, 000323, 012204, 000317, 000369, 000333, 000361, and 000363) homologues generated by using Clustal X and Clustal W. Conserved cysteine residues are indicated by an asterisk. The red box in the sequence of 06585 specifies the region used for the 3D model shown in C. (B) Unrooted phylogenetic tree was constructed by the neighbor-joining method based on the sequence alignment as above. Anopheles genes are shaded in pink, Drosophila genes are shaded in blue, and Aedes genes are shaded in orange. The bootstrap values of 1,000 replicates are indicated. The scale bar represents the amino acid divergence. (C) Three-dimensional model of the Anopheles putative serine protease inhibitor 06585. The cysteine residues engaged in disulfide bridges and the free Cys-5g are shown in ball-and-stick form in yellow.

