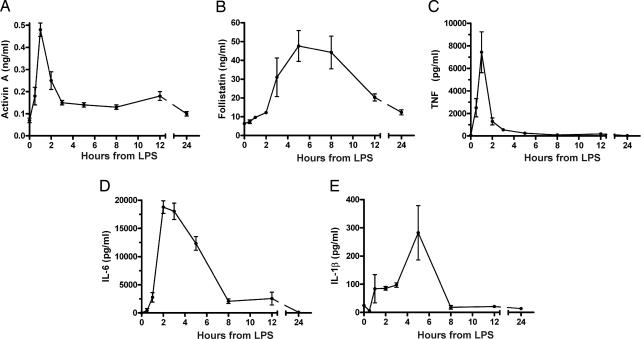
Fig. 1.
Release of activin A, follistatin, and other cytokines in mice challenged with phenol-purified LPS. (A) Activin A showed a typical rapid but transient increase within 1 h of LPS. (B) Follistatin was significantly elevated 3 h after LPS. (C) TNF concentrations peaked sharply and were significantly elevated 30 min after LPS injection, peaking at 1 h (P < 0.01). (D) IL-6 peaked at 2 h after LPS (P < 0.01) and returned to basal levels between 5 and 8 h. (E) IL-1β slowly increased, peaked at 5 h, and then returned to basal levels. All data are mean ± SE.

