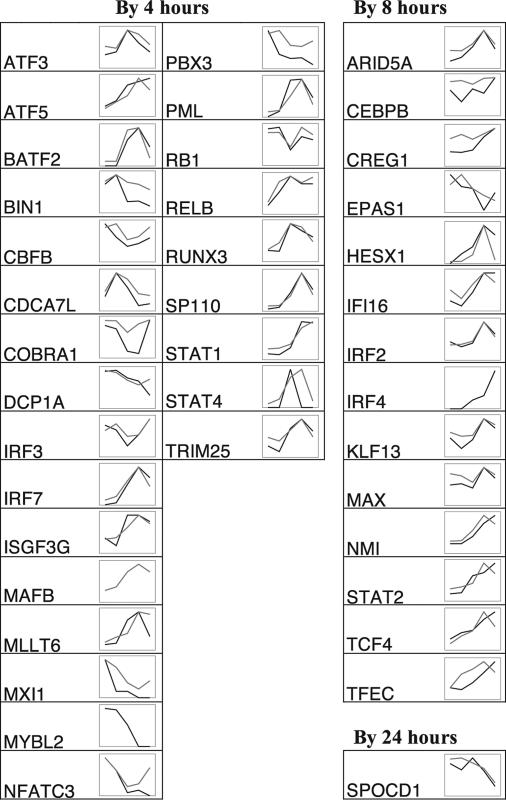
Fig. 4.
Shape of TF expression changes in stimulated macrophages with measurements normalized to the value of the highest time point. TFs showing a first significant time point of 4, 8, or 24 h are shown. Black, MPSS tpm; gray, Affymetrix signal. Abscissa time points (not to scale) are basal and 2, 4, 8, and 24 h after addition of LPS. Raw values and statistics are recorded in the online material.

