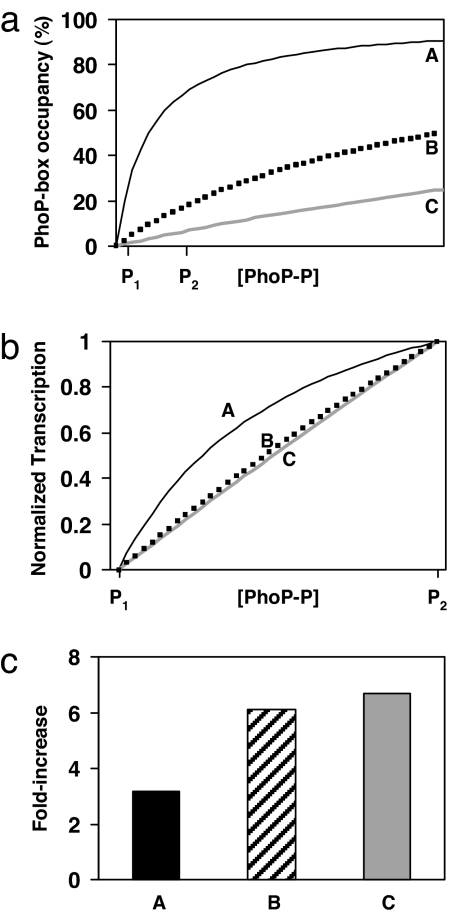
Fig. 2.
A comparison of hypothetical PhoP-P binding curves and normalized transcription profiles for three promoters with different PhoP-P dissociation constants. (a) PhoP-P binding curves for three promoters (A, B, and C) with different dissociation constants. P1 and P2 denote [PhoP-P] at high and low [Mg2+], respectively. In this study, we assume simple binding at these promoters; however, the conclusions of this analysis are the same for the cases of binding by a PhoP-P dimer or of cooperative binding. We also assume in this analysis that the rate of transcription for a particular promoter is a linear function of its fractional occupancy by PhoP-P. (b) The transcription profiles of the promoters in a normalized so that the transcription levels coincide at P1 and P2. The promoters with PhoP-P dissociation constants above P2 (promoters B and C) have normalized transcription profiles that are essentially indistinguishable. In contrast, promoter A, which has a dissociation constant below P2, has a distinct normalized transcription profile. (c) Fold increase in transcription from P1 to P2 for the promoters in a. Note that promoters with different PhoP-P dissociations constants greater than P2 (promoters B and C) show the same fold increase. For details of the analysis, see SI Text.

