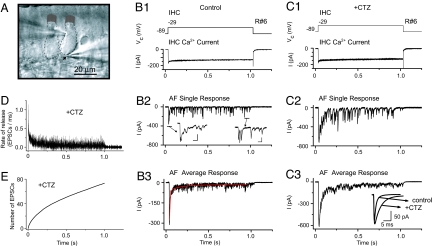
Fig. 1.
Depression of AF activity during IHC depolarization mostly depends on a presynaptic mechanism. (A) Differential interference contrast image of the excised organ of Corti preparation; with patch pipette on the left approaching an (outlined) IHC, pipette on the right, an afferent bouton (indicated by arrow). (B and C) Simultaneous recording R6 of IHC and AF with and without 100 μM CTZ. IHC Ca2+ buffer contained 1 mM EGTA. (B1 and C1) IHC voltage command (Vc) was applied every 30 s for 1 s and isolated IHC Ca2+ current. (B2 and C2) AF single responses, holding potential −84 mV. (B2 Inset) Peak AF response and single EPSCs later in the AF response. (Scale bars: 2 ms, 50 pA.) (B3 and C3) AF average responses to 13 (Control) and 12 (CTZ) depolarizations. Peak amplitudes: control, 314 ± 27 pA; CTZ, 618 ± 25 pA. Red trace, double exponential fit, τ1 = 7.4 ms, τ2 = 135 ms. (C3 Inset) Average EPSCs for R6. Control: amplitude 139 ± 7 pA, τdecay 1.1 ± 0.1 ms, n = 69. CTZ: amplitude 152 ± 10 pA, τdecay 3.9 ± 0.1 ms, n = 36. (D) Deconvolution (average of six recordings, 96 IHC depolarizations) of average AF responses with average EPSCs. (E) Integral of deconvolution in D.

