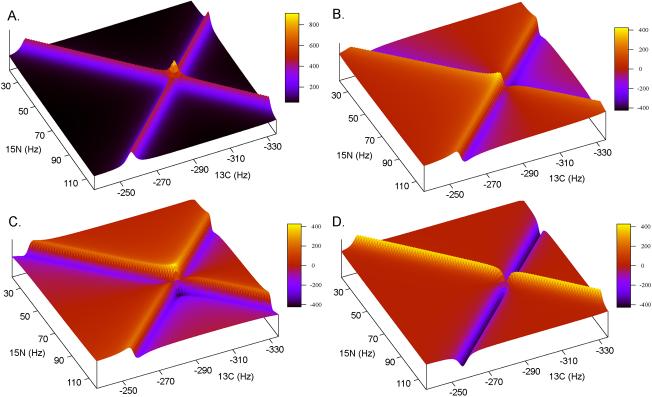
Fig. 2.
An example of how the 2D-FT can be used to generate absorptive and dispersive spectra with respect to t1 (ω1) and t2 (ω2). Inset A shows the real-real spectra, SRR(ω1, ω2)), generated when the matching Fourier transform is used, i.e. CC-FT for cos-cos modulated data. Inset B shows the imaginary-real spectra, SIR(ω1, ω2)), generated by not matching the FT with respect t1 (ω1) while matching it with respect to t2 (ω2), i.e. SC-FT for cos-cos modulated data. Insets C and D show the other two spectra that can be generated SRI(ω1, ω2) and SII(ω1, ω2), respectively. Table 1 outlines the complete procedure. The data was generated in the same way as in Fig. 1 and plotted to view only the area centered on the peak at −300,75 Hz.

