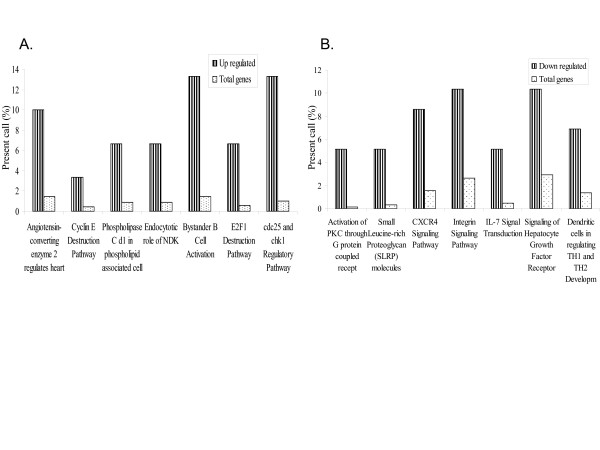
Figure 4.
Ontological analysis of the genes that were up (a) or down (b) regulated by VEEV in PBMC. RNA samples were isolated and hybridized on the cDNA microarray slides as detailed in materials and methods. Images were analyzed using GenePix 4.0 and data were analyzed using GeneSpring 7.0. Data were then analyzed using FATIGO+ to identify functional classes regulated by the virus. We calculated the percentage of each ontological class found in the list of genes regulated by VEEV and compared it to the percentage of found in the total gene list of the cDNA array.

