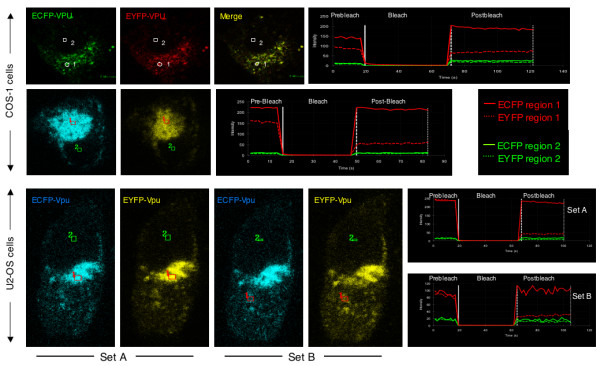
Figure 6.

FRET analysis of Vpu interactions. COS-1 and U2-OS cells were cotransfected with Vpu-ECFP and Vpu-EYFP expression vectors and FRET was performed as described in Methods. Representative images for COS-1 and U2-OS cells are shown together with a kinetic profile of the FRET experiment. For U2-OS cells, sets A and B represent the same cell, with FRET carried out in two different regions of colocalization indicated by the box marked 1; the box marked 2 represents a control region of the cell. A total of 4 independent FRET experiments were carried out in 7–10 different cotransfected cells each time.
