
Figure 1.
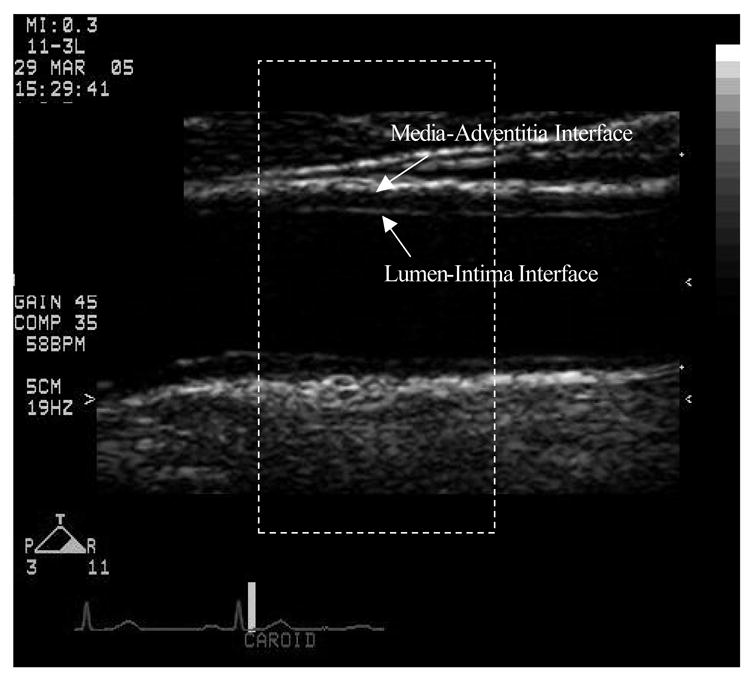
Carotid image of a selected frame of a typical participant. The white arrows mark the lumen-intima and media-adventitia interfaces. The dotted line represents the selected region for analysis.
Official websites use .gov
A
.gov website belongs to an official
government organization in the United States.
Secure .gov websites use HTTPS
A lock (
) or https:// means you've safely
connected to the .gov website. Share sensitive
information only on official, secure websites.
Carotid image of a selected frame of a typical participant. The white arrows mark the lumen-intima and media-adventitia interfaces. The dotted line represents the selected region for analysis.