
Figure 2.
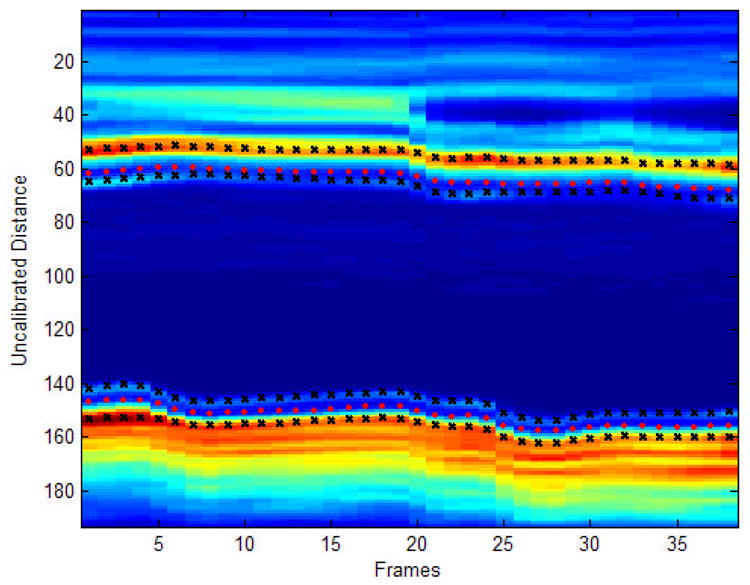
Automated IMT detection. The image represents the signal intensity of the region selected for analysis on far wall of the left common carotid artery for all frames of a typical subject. The orange color indicates high intensity values, and blue color indicates low intensity values. The pink circles represent the estimated boundaries for the carotid diameter. The black ‘x’s represent the estimated lumen-intima and media-adventitia interfaces.