
Figure 2. Mutational analysis of TCaRE3.
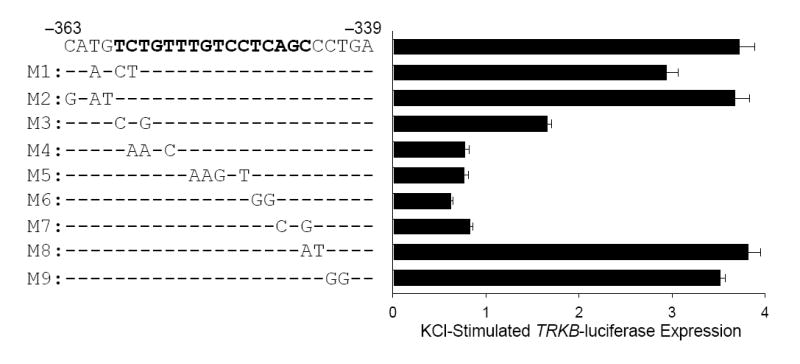
The −944/−325 TRKB P2-luciferase construct was subjected to scanning mutagenesis from −399 to −363 to map the nucleotides essential for TCaRE3 function. Cortical neurons were transiently transfected with corresponding P2-luciferase reporter constructs (left). Two days after transfection, cultures were stimulated with 50 mM KCl and harvested for luciferase assays (right). Bars show the averages of quadruplicate determinations ± sem. This mutation analysis revealed that the region from −344 to −359 (bold) is required for Ca2+-stimulated expression of TRKB P2.