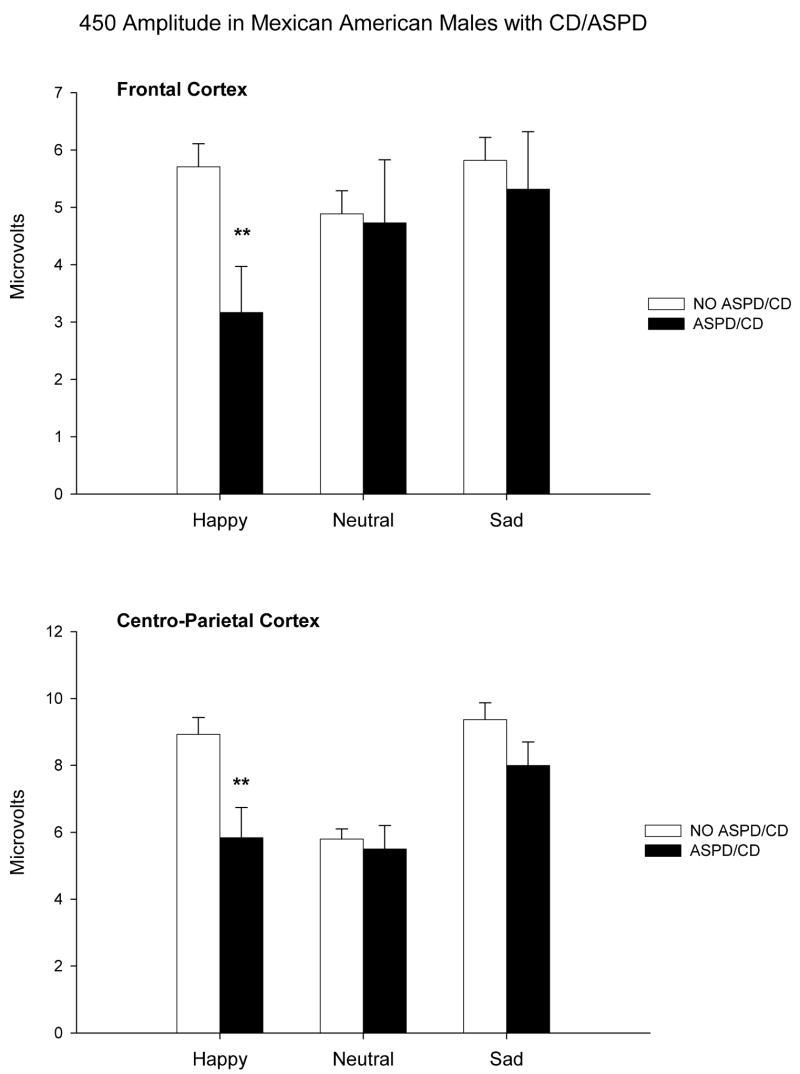
Figure 2.
P450 Amplitude (microvolts) to happy, neutral, and sad facial expressions in those participants with a select anxiety or affective disorder (AXAF) in the black bars, and in those without a select anxiety or affective disorder (no AXAF) in the open bars. Values are given as means±SEM. Asterisk indicates a significant difference between groups. (*p<0.05, ** p<0.01)

