Figure 4.

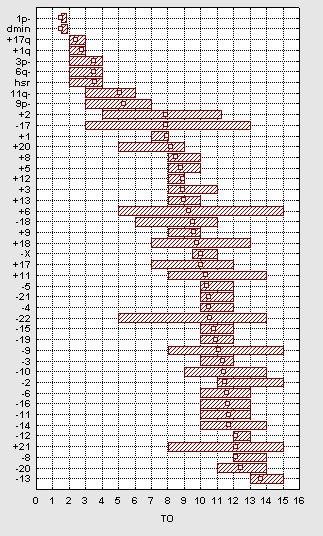
Temporal analysis. The estimated TO values are indicated by open squares. The range of the 25th and 75th quartiles is indicated by filled boxes. The imbalances are ordered with respect to their estimated TO values.

Temporal analysis. The estimated TO values are indicated by open squares. The range of the 25th and 75th quartiles is indicated by filled boxes. The imbalances are ordered with respect to their estimated TO values.