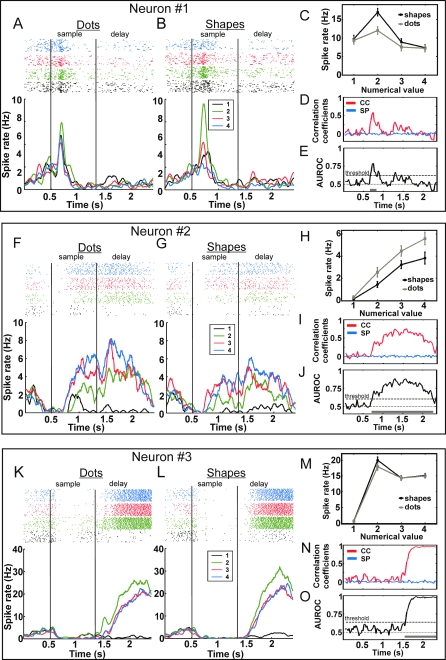
Figure 3. Neural PFC Responses.
(A–E) Neuron 1 showed highest firing rates for numerical value two in the dot (A) and shape (B) protocols in the early sample phase. Top panels in (A) and (B) show dot raster histograms (each dot represents an action potential); bottom panels are the corresponding color-coded spike density histograms (averaged and smoothed with a 100-ms Gaussian kernel for illustrative purposes only). The first 500 ms indicates the fixation period. Black vertical lines mark sample onset (500 ms) and offset (1,300 ms). (C) Tuning functions in the sample period for the dot and shape protocols, calculated from the raw firing rates in a 400-ms latency shifted window. (D) Time course of original CCs (red) and chance CCs (SPs, blue). (E) Time course of discriminability between CCs and SP quantified as the AUROC. The horizontal bar above the x-axis indicates the time interval of significant cross-correlation between tuning to the dot and shape protocols; in this period, the neuron associated numerical values in the two protocols. The black dashed line depicts the threshold (mean of ROC values derived during fixation period ± three standard deviations). The gray dashed line represents chance level (0.5).
(F–J) Neuron 2 exhibiting four as preferred numerical value in the sample and delay period. Same layout as in (A–E); tuning functions were derived from the second ANOVA window of the sample period. (I and J) Neuron 2 associated numerical values in both protocols throughout the entire sample and delay period.
(K–O) Neuron 3 exhibited two as preferred numerical value in the delay period. Same layout as in (A–E); tuning functions were derived from the second ANOVA window of the delay period.

