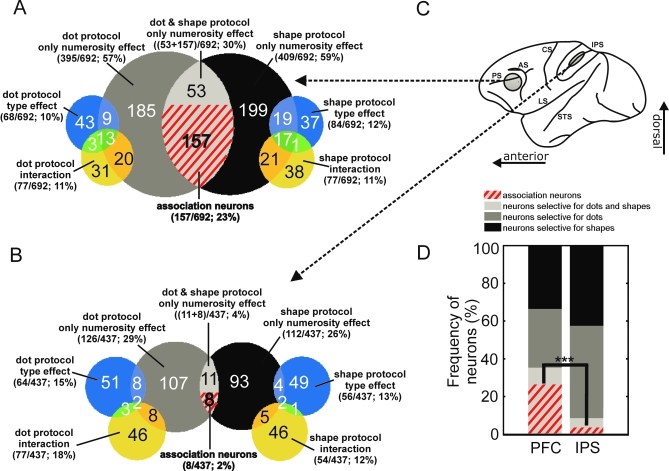
Figure 6. Quantitative Summary and Comparison of Neuronal Response Classes in PFC and IPS.
(A and B) Venn diagrams summarizing the results from the two-factor ANOVA and cross-correlation analysis in the PFC (A) and IPS (B). Data from the sample and delay period are combined. Numbers correspond to the numbers of neurons selective for each class.
(C) Lateral view of a monkey brain. Circles represent schematic locations of recording sites in the frontal and parietal lobe. AS, arcuate sulcus; CS, central sulcus; PS, principal sulcus; STS, superior temporal sulcus; LS, lateral sulcus.
(D) Frequency of association neurons. Proportions correspond to the added numbers of neuron classes (i.e., association neurons, ANOVA-selective neurons for both protocols, and ANOVA-selective neurons for shape or dot protocol; ***, p < 0.001).

