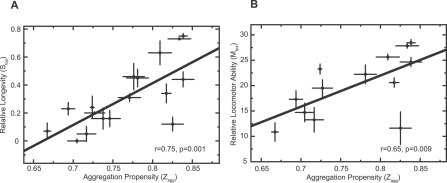
Figure 2. Correlation between In Vivo Toxicity and Aggregation Propensity (Z agg).
(A) There is a significant correlation between the propensities of the Aβ42 variants to aggregate (Z agg) and the relative survival of the flies (S tox; r = 0.75, p = 0.001).
(B) There is a similarly significant correlation between the propensities of Aβ42 variants to aggregate (Z agg) and the locomotor abilities of the flies (M tox; r = 0.65, p = 0.009).
In both panels the errors in the in vivo measurements (y-axis) are standard errors of the mean arising from the average of the independent lines tested for each variant. The errors in the predictions of aggregation propensity (Z agg) are also shown (x-axis).

