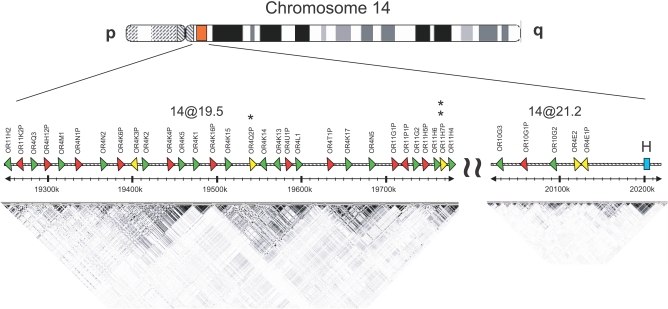
Figure 3. The Genomic Region Associated with IVA Hyperosmia.
OR genes are represented by red, green, and yellow triangles indicating pseudogenes, intact genes, and SPGs, respectively. The two SPGs showing the strongest association with IVA sensitivity are marked with single and double asterisks. A linkage disequilibrium plot of SNPs with minor allele frequency ≥ 5% in HapMap CEU [46] is depicted for this genomic region. The pairwise r 2 values are indicated on a gray scale, with black = 1 and white = 0. This region contains also the putative OR-specific trans-acting enhancer element (H) [47,48].

