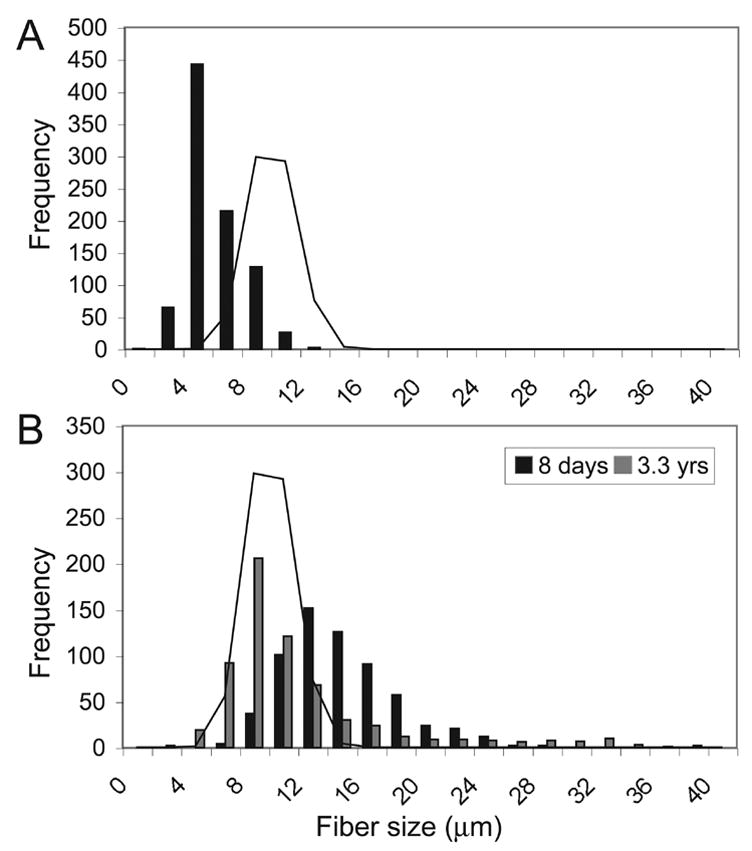
Figure 2.

(A) Histogram of morphometry data from patient 462-1, shows a shift toward smaller sized fibers with a mean myofiber size of 6.1±1.8 μm. (B) Histogram from patient 171-1 comparing morphometry data from quadriceps biopsies taken at 8 days of age (black) and at 3.3 years of age (grey). There is an overall decrease in mean myofiber size, from 14.9±3.8 μm to 12.0±6.1 μm, in the interval between biopsies (p<0.0001). Both biopsies contain some large myofibers, but this population is far more prevalent in the second biopsy. Solid line indicates average frequency distribution for a 12 day old normal control biopsy.
