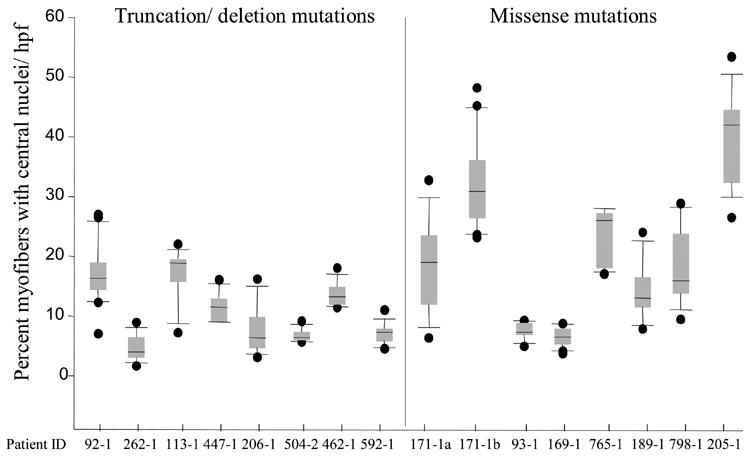
Figure 3.

Box plots of percent myofibers with central nuclei/hpf. The mean percent of myofibers with central nuclei ranged from 4.7% to 39.7% with wide variability from field-to-field in some biopsies. The black horizontal line in each box denotes the mean. The top of the box denotes the 75th percentile, while the bottom indicates the 25th percentile. The top bar shows the 95th percentile and the bottom bar shows the 5th percentile. The dots outside of the bars represent outlying data points.
