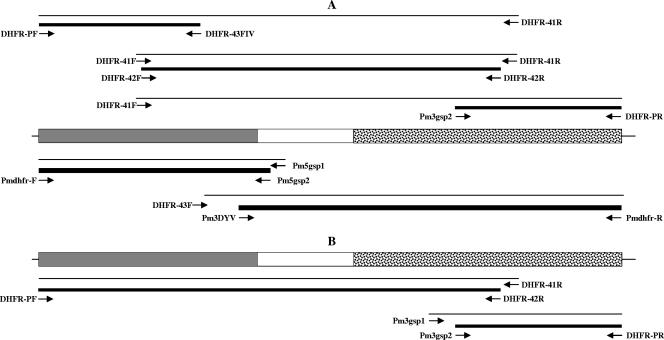
FIG. 1.
Schematic representation of the dhfr-ts genes from P. malariae (A) and P. brasilianum (B). The 5′-end region coding for the DHFR domain is shaded in gray, the 3′-end region coding for the TS domain is stippled, and the linker region is left blank. The positions of the oligonucleotides used for nested PCR amplification of bands that were sequenced are indicated. Thin lines indicate the product from the primary amplification reaction, and thick lines indicate the product obtained after the secondary amplification reaction.

