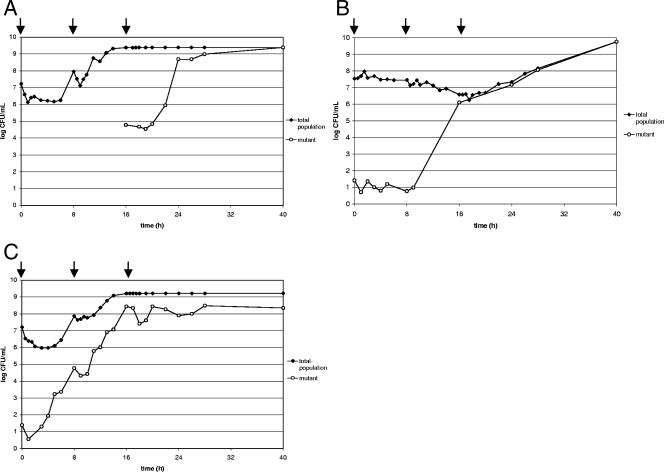
FIG. 1.
(A and B) CFU counts indicating the total populations of PAO1 cells and the populations of mutant cells during treatment with meropenem (three 1-g doses) (A) and during treatment with ceftazidime (three 2-g doses) (B). (C) CFU counts indicating the total population of 12-09-15 cells and the population of mutant cells during treatment with meropenem (three 1-g doses). Arrows indicate dosing times.

