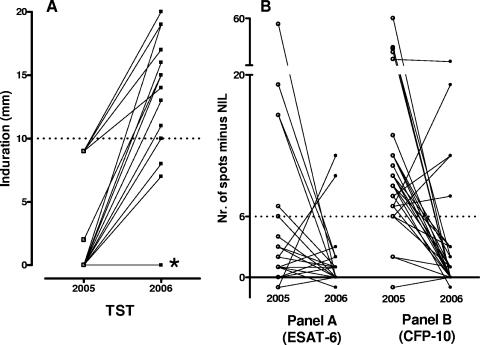
FIG. 1.
(A) TST responses in 2005 and 2006. *, 10 subjects with TST results of 0 mm at both time points; dotted line, cutoff value for a positive test. (B) Time course of individual spot counts for ESAT-6 (test panel A) and CFP-10 (test panel B) of the TSPOT.TB assays in 2005 and 2006. Dotted line, the cutoff value for a positive test. Nil, spots obtained in the medium-stimulated well.

